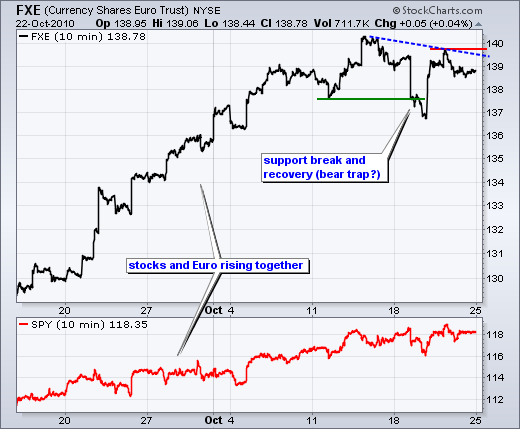
The Euro Currency Trust (FXE) and the S&P 500 ETF (SPY) have been positively correlated throughout 2010. This positive correlation is especially strong since late August. Both are up over 10% since late August. Why the positive correlation? First, a weak Dollar is beneficial to US exports because it makes US goods more competitive. Second, a weak Dollar encourages tourism in the US. Goods and services in the US are a lot cheaper for European tourists. Third, a weak Dollar is inflationary and this helps with the US debt load. It may backfire one day, but right now the weak Dollar is helping the stock market. A weak Dollar is also a symptom of low US interest rates. With interest rates so low, money is formed out of fixed income and into stocks and commodities.
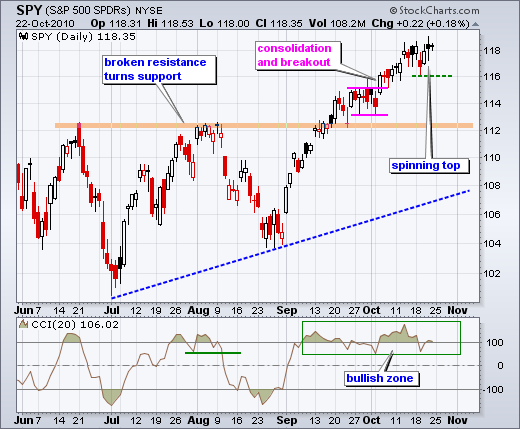
With the bounce back above 118, SPY forged a reaction low at 116 that could be seen as short-term support. A move below this level would probably trigger a CCI break below 50. The combination would be short-term bearish and argue for a correction towards the next support zone around 112. A spinning top candlestick formed on Thursday and a small doji on Friday. These show indecision. However, indecision after an advance is neutral. Some sort of downside break is needed to actually forge a reversal. We have yet to see such a break.

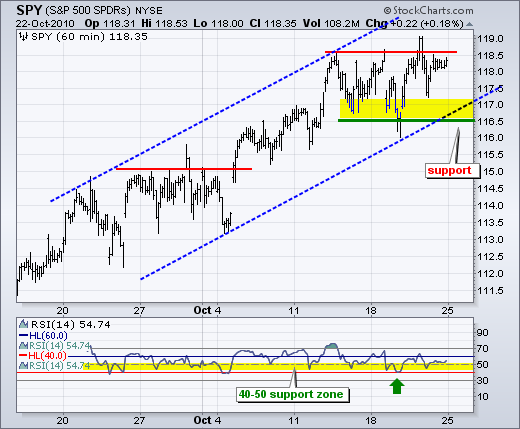
On the 60-minute chart, SPY is trading at the top of its recent trading range. Even though the ETF spiked above 119 last week, I am keeping range resistance around 118. With a strong open expected this morning, it looks like we will see another range breakout. This would affirm the current uptrend and argue for a move towards 120 or so. The range is around 2 points high and a breakout at 118 would project another two points higher. With a few bounces since mid October, there is a support zone around 116-117. Also notice that RSI continues to hold the 40-50 zone. Again, both SPY and RSI need to break there respective support zones for a short-term trend reversal.

Key Economic Reports:
Oct 25 - 10:00 - Existing Home Sales
Oct 26 - 09:00 - Case-Shiller 20-city Index
Oct 26 - 10:00 - Consumer Confidence
Oct 27 - 07:00 - MBA Mortgage Applications
Oct 27 - 08:30 - Durable Orders
Oct 27 - 10:00 - New Home Sales
Oct 27 - 10:30 - Oil Inventories
Oct 28 - 08:30 - Jobless Claims
Oct 28 - 16:30 – Fed Balance Sheet
Oct 29 - 08:30 - GDP
Oct 29 - 09:45 - Chicago PMI
Oct 29 - 09:55 - Michigan Sentiment
Charts: Tuesday and Thursday in separate post.
-----------------------------------------------------------------------------
This commentary and charts-of-interest are designed to stimulate thinking. This analysis is not a recommendation to buy, sell, hold or sell short any security (stock ETF or otherwise). We all need to think for ourselves when it comes to trading our own accounts. First, it is the only way to really learn. Second, we are the only ones responsible for our decisions. Think of these charts as food for further analysis. Before making a trade, it is important to have a plan. Plan the trade and trade the plan. Among other things, this includes setting a trigger level, a target area and a stop-loss level. It is also important to plan for three possible price movements: advance, decline or sideways. Have a plan for all three scenarios BEFORE making the trade. Consider possible holding times. And finally, look at overall market conditions and sector/industry performance.


