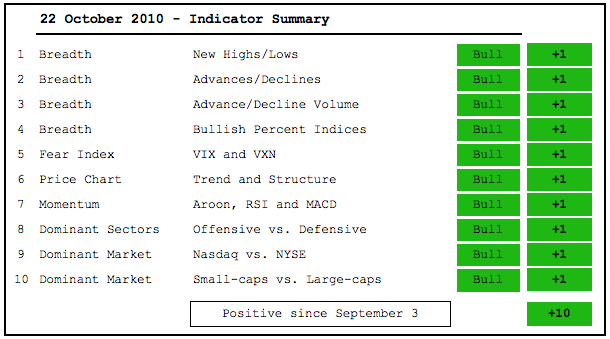
There is no change in the indicator summary, which remains firmly bullish. With all ten indicators in bull mode, it would take a few weeks to turn the tide bearish. I am not predicting this. I am merely reinforcing the lagging nature of this indicator summary. It is not designed to predict market turns. Instead, it is designed to give the current assessment of market conditions, which are bullish until proven otherwise.
- AD Lines: Bullish. The NYSE AD Line hit a new 52-week high last week (bullish) and the Nasdaq AD Line broke its summer high last week (bullish).
- AD Volume Lines: Bullish. The NYSE AD Volume Line is lagging the AD Line, but remains in an uptrend overall (bullish). The Nasdaq AD Volume Line remains above its summer highs (bullish).
- Net New Highs: Bullish. Nasdaq and NYSE Net New Highs are trading below last week's elevated levels, but remain positive overall. The cumulative Net New Highs lines are still rising (bullish).
- Bullish Percent Indices: Bullish. With the Finance Bullish% ($BPFINA) climbing to 51.1%, all Bullish Percent Indices are now above 50%.
- VIX/VXN: Bullish. The S&P 500 Volatility Index ($VIX) and the Nasdaq 100 Volatility Index ($VXN) remain in downtrends. Falling volatility means lower risk, which is bullish for stocks.
- Trend Structure: Bullish. QQQQ, SPY, DIA and IWM are all trading above their summer highs (bullish).
- SPY Momentum: Bullish. MACD(5,35,5) and Aroon (20) moved into positive territory the second week of September and RSI surged above 60.
- Offensive Sector Performance: Bullish. Finance remains the big laggard, but tech, consumer discretionary and industrials are leading. 3 out of 4 are in bull mode.
- Nasdaq Performance: Bullish. The $COMPQ:$NYA ratio moved above its September high and remains in an uptrend. (bullish).
- Small-cap Performance: Bullish. The $RUT:$OEX was hit hard the last five days, but remains in an uptrend overall.
- Breadth Charts have been updated (click here)
-----------------------------------------------------------------------------
This commentary and charts-of-interest are designed to stimulate thinking. This analysis is not a recommendation to buy, sell, hold or sell short any security (stock ETF or otherwise). We all need to think for ourselves when it comes to trading our own accounts. First, it is the only way to really learn. Second, we are the only ones responsible for our decisions. Think of these charts as food for further analysis. Before making a trade, it is important to have a plan. Plan the trade and trade the plan. Among other things, this includes setting a trigger level, a target area and a stop-loss level. It is also important to plan for three possible price movements: advance, decline or sideways. Have a plan for all three scenarios BEFORE making the trade. Consider possible holding times. And finally, look at overall market conditions and sector/industry performance.


