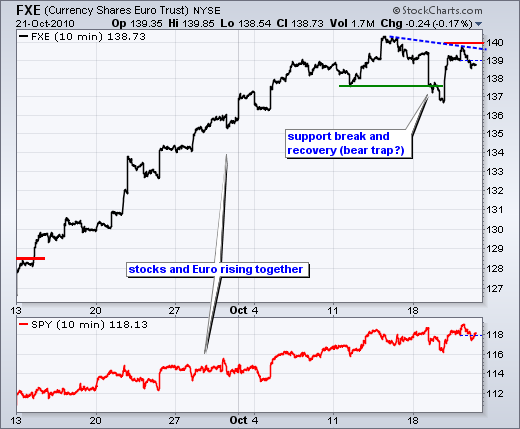
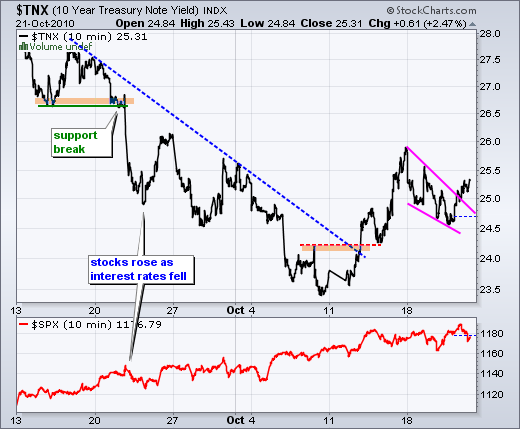
The intermarket picture is getting quite interesting. First, the 10-year Treasury Yield ($TNX) broke wedge resistance to signal a continuation of last week's breakout. A bullish breakout in yields means a bearish breakdown in bonds. Frankly, I am not sure how or if this will affect stocks. The relationship between stocks and bonds has been all over the place the last five weeks. Rising rates signal economic growth, inflationary pressure and/or a change in outlook for US debt. In other words, bond investors may be demanding more return because of the US deficit. The second chart shows the Euro Currency Trust (FXE) breaking support and then surging back toward resistance. Was this a bear trap? A break above 140 would be bullish for FXE and this would be positive for stocks, which have been positively correlated with the Euro. Another downturn in the Euro would be negative for stocks. Greece has another due date approaching on November 30th.

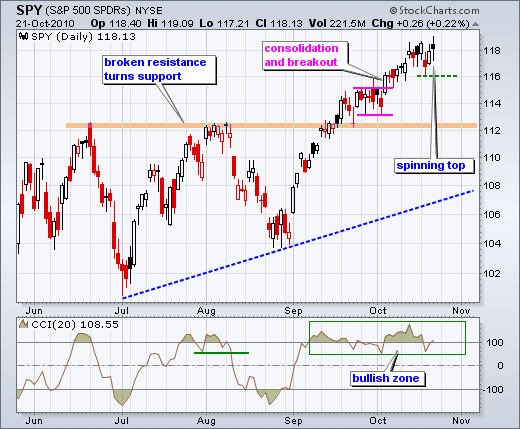
With the bounce over the last two days, SPY forged a reaction low at 116 that could be seen as short-term support. A move below this level would probably trigger a CCI break below 50. The combination would be short-term bearish and argue for a correction towards the next support zone around 112. A spinning top candlestick formed on Thursday. These show indecision. However, indecision after an advance is neutral. Some sort of downside break is needed to actually forge a reversal.

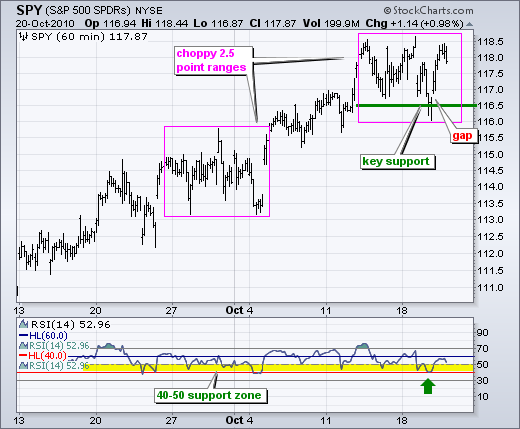
On the 60-minute chart, SPY remains in a volatile trading range that looks similar to the late September/early October period. Notice that SPY dipped sharply the last week of September and then failed to hold the breakout at 115. After another pullback in early October, the ETF gapped up and broke resistance at 115. Flash forward and we see a sharp decline to 116 and a failed breakout at 118.50 this week. The bulls still have the edge here. Look for SPY to break 116.50 and RSI to break 40 for a trend reversal. Incidentally, the short-term uptrend has been in place since the September 1 breakout.

Key Economic Reports:
Fri-Sat – Oct 22-23 – G20 Finance Ministers and Central Bankers meet with currency movements at the top of the agenda.
Charts: Tuesday and Thursday in separate post.
-----------------------------------------------------------------------------
This commentary and charts-of-interest are designed to stimulate thinking. This analysis is not a recommendation to buy, sell, hold or sell short any security (stock ETF or otherwise). We all need to think for ourselves when it comes to trading our own accounts. First, it is the only way to really learn. Second, we are the only ones responsible for our decisions. Think of these charts as food for further analysis. Before making a trade, it is important to have a plan. Plan the trade and trade the plan. Among other things, this includes setting a trigger level, a target area and a stop-loss level. It is also important to plan for three possible price movements: advance, decline or sideways. Have a plan for all three scenarios BEFORE making the trade. Consider possible holding times. And finally, look at overall market conditions and sector/industry performance.


