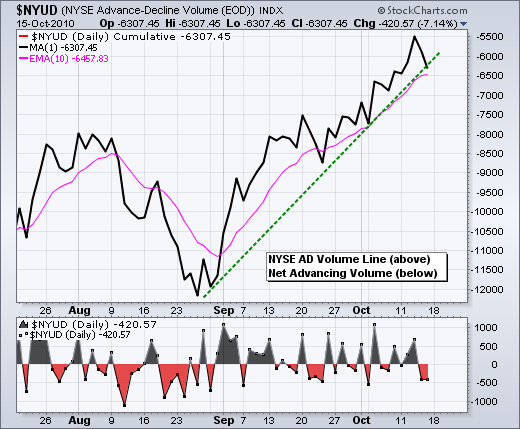
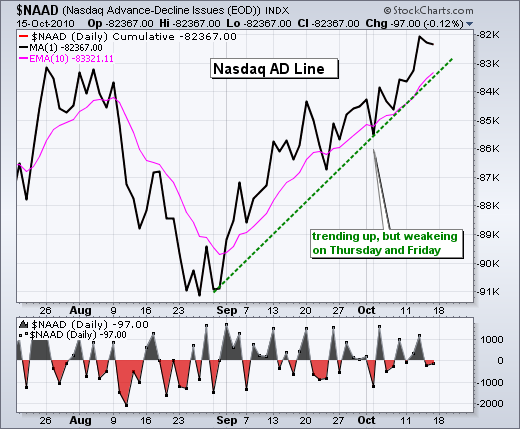
Here's one for the record books. The Nasdaq was up 1.37% and the Nasdaq 100 was up 2.10% on Friday, but Net Advances were a negative 97. Despite big advances, there were more declining stocks on the Nasdaq than advancing stocks. Net Advancing Volume was positive (+627), but well below the +1000 level, which shows real strength. NYSE Net Advances and Net Advancing Volume were both negative as finance weighed on the broader market. Basically, we can chalk up Friday's rally to big techs. Nine of the ten most active Nasdaq stocks were up on the day (Intel was unchanged). In contrast, nine of the ten most active NYSE stocks were down on the day. How's that for contrast. In short, something ain't right with this picture.

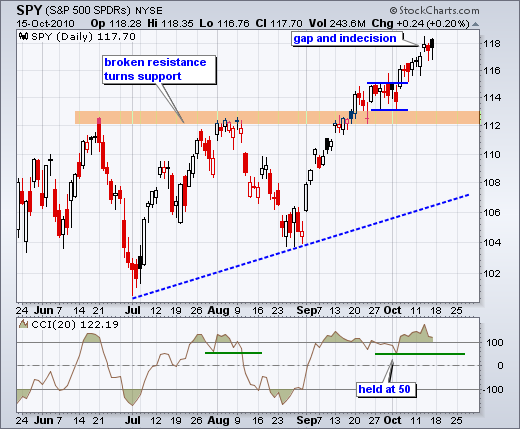
On the daily chart, SPY remains in an uptrend overall. The last major breakout occurred around 112 and this area turns into the first support zone to watch on any pullback or correction. Obviously, the pullback has yet to start as SPY remains near 118. The ETF gapped up on Wednesday and stalled with an indecisive candlestick. A couple of hanging man candlesticks formed on Thursday-Friday as the ETF dipped into the gap zone twice and recovered. A move below the hanging man lows would be short-term negative and could start the pullback or consolidation process. CCI support remains at 50.

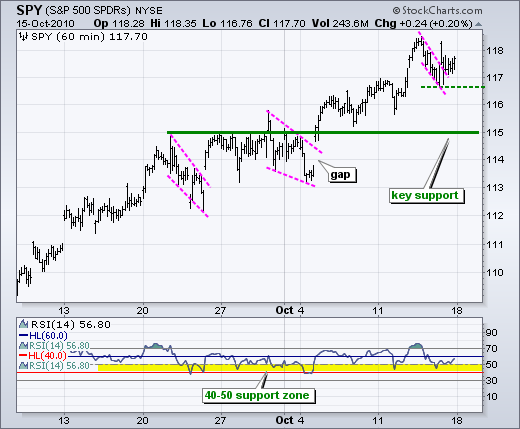
On the 60-minute chart, SPY formed its third flag/wedge in four weeks and broke resistance with a surge on Wednesday. There was no follow through though. Instead, SPY pulled back below 118 and consolidated. Technically, the breakout is still holding and remains bullish until proven otherwise. First support is marked at 116.5 and a break below this level would argue for a move towards key support around 115. RSI support remains in the 40-50 zone.

Key Economic Reports:
Mon – Oct 10 - 09:15 - Industrial Production
Mon - Oct 18 - 10:00 - NAHB Housing Market Index
Tue - Oct 19 - 08:30 - Housing Starts & Building Permits
Tue - Oct 19 - 08:30 - Building Permits
Wed - Oct 20 - 07:00 - MBA Mortgage Applications
Wed - Oct 20 - 10:30 - Oil Inventories
Wed - Oct 20 - 14:00 - Fed's Beige Book
Thu - Oct 21 - 08:30 - Jobless Claims
Thu - Oct 21 - 10:00 - Leading Indicators
Thu - Oct 21 - 10:00 - Philadelphia Fed
Fri – Oct 22 – All Day – G20 Finance Ministers and Central Bankers meet
Charts of Interest: Tuesday and Thursday.
-----------------------------------------------------------------------------
This commentary and charts-of-interest are designed to stimulate thinking. This analysis is not a recommendation to buy, sell, hold or sell short any security (stock ETF or otherwise). We all need to think for ourselves when it comes to trading our own accounts. First, it is the only way to really learn. Second, we are the only ones responsible for our decisions. Think of these charts as food for further analysis. Before making a trade, it is important to have a plan. Plan the trade and trade the plan. Among other things, this includes setting a trigger level, a target area and a stop-loss level. It is also important to plan for three possible price movements: advance, decline or sideways. Have a plan for all three scenarios BEFORE making the trade. Consider possible holding times. And finally, look at overall market conditions and sector/industry performance.


