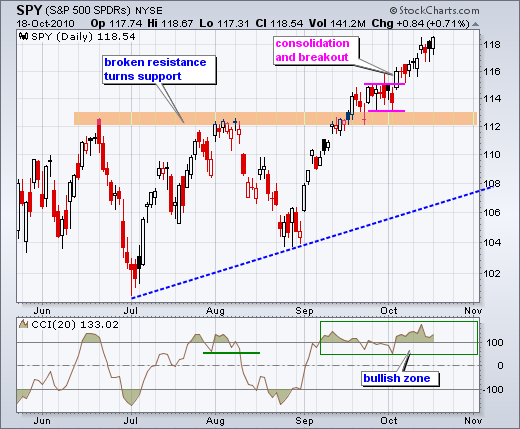
Stalling is not the same as weakness. I noted yesterday that SPY gapped up on Wednesday and stalled. Hanging man candlesticks followed on Thursday and Friday as the stall extended. Such indecision can sometimes result in a short-term reversal, but some sort of downside break or catalyst is needed to confirm an actual reversal. Instead of reversing lower on Monday, SPY moved back above 118 and closed strong. Strength in the finance sector buoyed the market. I am not quite convinced with yesterday's surge in XLF and would like to see a follow through breakout at 15 before getting impressed. As far as SPY is concerned, the hanging man lows from Thursday-Friday mark short-term support and broken resistance marks the next support zone around 112. CCI remains in its bull zone with support at 50.

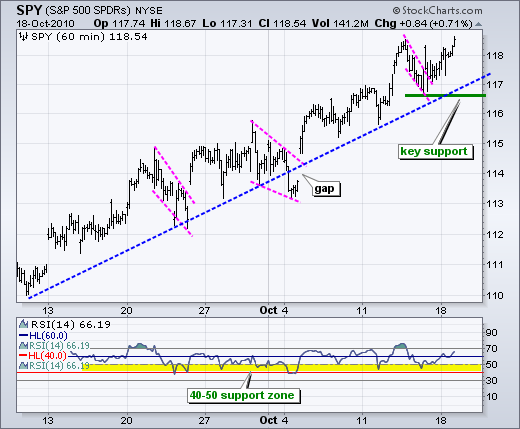
On the 60-minute chart, SPY broke flag/wedge resistance and this breakout held as the ETF challenged last week's high on Monday. With this challenge, I am raising key support to 116.5. A move below this level would break the trendline and forge a lower low, thus reversing the uptrend. I will also require RSI to break below its support zone (40-50) for bearish confirmation from momentum. The blue trendline represents an "internal" trendline because it cuts through a couple of spike lows. Even so, this trendline's angle captures the current rate of ascent.

Key Economic Reports:
Tue - Oct 19 - 08:30 - Housing Starts & Building Permits
Tue - Oct 19 - 08:30 - Building Permits
Wed - Oct 20 - 07:00 - MBA Mortgage Applications
Wed - Oct 20 - 10:30 - Oil Inventories
Wed - Oct 20 - 14:00 - Fed's Beige Book
Thu - Oct 21 - 08:30 - Jobless Claims
Thu - Oct 21 - 10:00 - Leading Indicators
Thu - Oct 21 - 10:00 - Philadelphia Fed
Fri – Oct 22 – All Day – G20 Finance Ministers and Central Bankers meet
Charts of interest: Separte post.
-----------------------------------------------------------------------------
This commentary and charts-of-interest are designed to stimulate thinking. This analysis is not a recommendation to buy, sell, hold or sell short any security (stock ETF or otherwise). We all need to think for ourselves when it comes to trading our own accounts. First, it is the only way to really learn. Second, we are the only ones responsible for our decisions. Think of these charts as food for further analysis. Before making a trade, it is important to have a plan. Plan the trade and trade the plan. Among other things, this includes setting a trigger level, a target area and a stop-loss level. It is also important to plan for three possible price movements: advance, decline or sideways. Have a plan for all three scenarios BEFORE making the trade. Consider possible holding times. And finally, look at overall market conditions and sector/industry performance.


