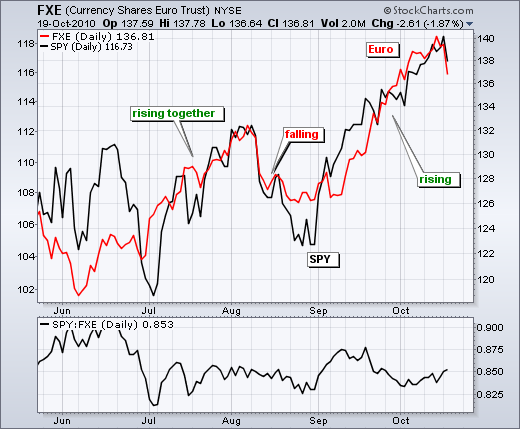
Big moves in the Euro and Apple weighed on stocks Tuesday. Apple declined after its earnings announcement, which was surely a buy-the-rumor sell-the-news event. The Euro Currency Trust (FXE) declined almost 2% after hitting a key retracement level last week. This was covered in Friday's Market Message. For whatever reason, the Euro and the stock market have been positively correlated since the beginning of July. A weaker Dollar makes US goods more competitive. This is a boost to multi-nationals and exporters. Strength in the Euro also detracts from Europe's debt crisis to facilitate the risk-on trade, which has been working since early September.
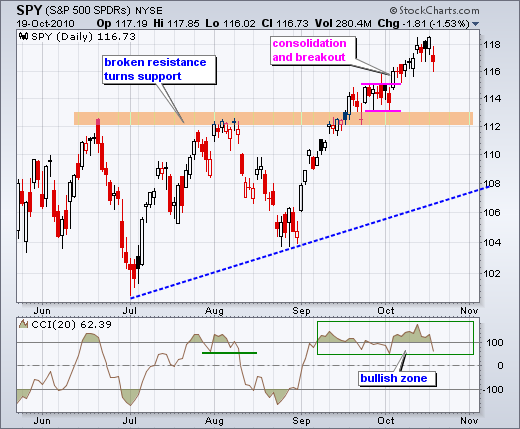
While yesterday's decline seems sharp, it is still just a blip on the daily chart. SPY remains in an uptrend overall with broken resistance turning into the next important support zone around 112. Early warning for a pullback or correction will come from the Commodity Channel Index (CCI). This momentum oscillator dipped to 62 on Tuesday. A break below the bull zone (50) would show enough weakness to warrant a trading range or correction.

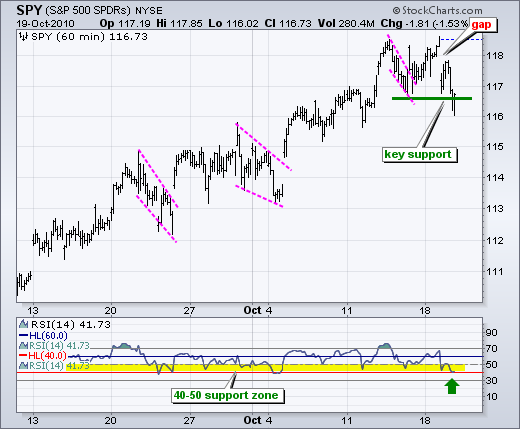
On the 60-minute chart, SPY failed to hold the flag/wedge breakout and broke below support at 116.5 intraday. Some late buying pushed the indicator above this support level by the close. This late bounce also pushed RSI back above 40. On a closing basis, the short-term trend remains with key support under assault. I am looking for RSI to close below 40 and SPY to finish below 116.50 before signaling a short-term trend reversal. When I say finish, I am referring to a 60-minute bar. It could be a bar at the end of the day or a bar during the day.

Key Economic Reports:
Wed - Oct 20 - 07:00 - MBA Mortgage Applications
Wed - Oct 20 - 10:30 - Oil Inventories
Wed - Oct 20 - 14:00 - Fed's Beige Book
Thu - Oct 21 - 08:30 - Jobless Claims
Thu - Oct 21 - 10:00 - Leading Indicators
Thu - Oct 21 - 10:00 - Philadelphia Fed
Fri – Oct 22 – All Day – G20 Finance Ministers and Central Bankers meet
Charts: Tuesday and Thursday.
-----------------------------------------------------------------------------
This commentary and charts-of-interest are designed to stimulate thinking. This analysis is not a recommendation to buy, sell, hold or sell short any security (stock ETF or otherwise). We all need to think for ourselves when it comes to trading our own accounts. First, it is the only way to really learn. Second, we are the only ones responsible for our decisions. Think of these charts as food for further analysis. Before making a trade, it is important to have a plan. Plan the trade and trade the plan. Among other things, this includes setting a trigger level, a target area and a stop-loss level. It is also important to plan for three possible price movements: advance, decline or sideways. Have a plan for all three scenarios BEFORE making the trade. Consider possible holding times. And finally, look at overall market conditions and sector/industry performance.


