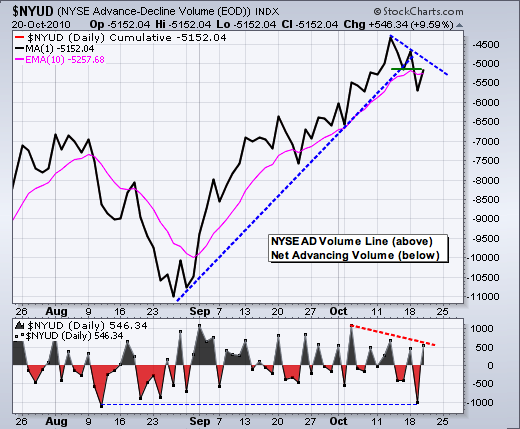
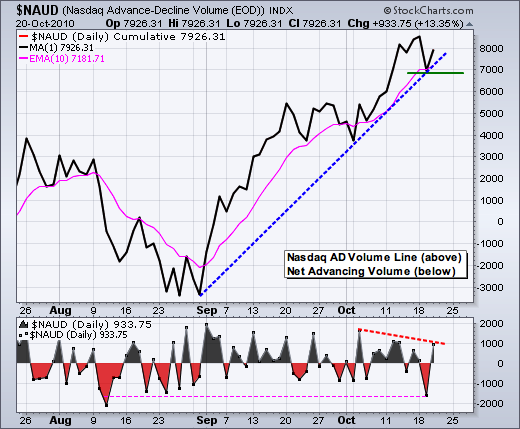
The bulls are clearly not going down without a fight. While yesterday's rebound looked impressive, breadth fell short of the prior highs and the bulls appear to be loosing steam. The first chart shows the Nasdaq AD Volume Line and Net Advancing Volume. The AD Volume Line remains in an uptrend overall. With yesterday's bounce, the AD Volume Line established its first support level to watch for a downside break. Net Advancing Volume, in the lower window, peaked in early October and formed lower highs the last two weeks. Although firmly positive, Net Advancing Volume did not even clear +1000 yesterday. In contrast, notice the Tuesday's downside dip was the deepest since the second week of August. Based on this stat, Tuesday's downside breadth was stronger than Wednesday's upside breadth. Score one for selling pressure. The second chart shows the NYSE AD Volume Line and Net Advancing Volume. The AD Volume Line has been trending down for over a week. There was a support break on Tuesday and the indicator remains below last week's high. While this downtrend is certainly young, it is a downtrend and a break above the upper trendline is needed to reverse it.

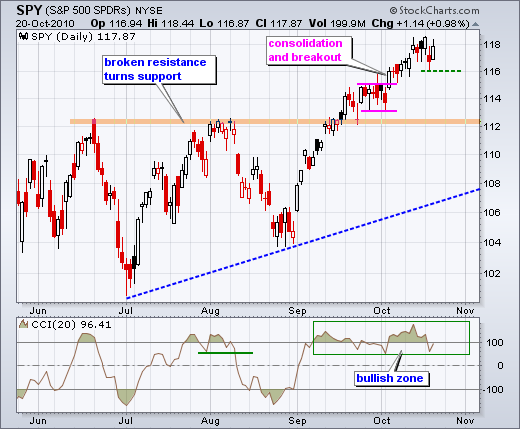
With Wednesday's bounce, SPY forged a reaction low at 116 that could be seen as short-term support. A move below this level would probably trigger a CCI break below 50. The combination would be short-term bearish and argue for a correction towards the next support zone around 112.

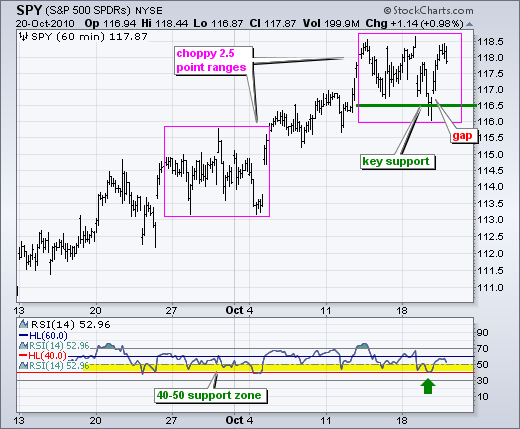
On the 60-minute chart, price action moves from the lower left to the upper right, which means an uptrend overall. Trading has turned quite choppy the past week as the ETF bounces between 116 and 118.5. This is the second choppy range in the last few weeks. The first ended with an upside breakout in early October. However, this breakout occurred with a strong breadth. NYSE Net Advancing Volume exceeded +1000 and Nasdaq Net Advancing Volume exceeded +1500. As noted above, we did not see this kind of breadth yesterday, which leads me to speculate that resistance at 118.5 will hold. Top pickers are licking their chops with a pretty good reward-to-risk ratio at current levels. While picking a top offers the best reward-to-risk ratio, the risk of failure (a loosing trade) is above average. A definitive short-term trend reversal would require a support break at 116.5 and an RSI break at 40.

Key Economic Reports:
Thu - Oct 21 - 08:30 - Jobless Claims
Thu - Oct 21 - 10:00 - Leading Indicators
Thu - Oct 21 - 10:00 - Philadelphia Fed
Fri – Oct 22 – + Sat – G20 Finance Ministers and Central Bankers meet
Charts: Separate post on Tuesdays and Thursdays.
-----------------------------------------------------------------------------
This commentary and charts-of-interest are designed to stimulate thinking. This analysis is not a recommendation to buy, sell, hold or sell short any security (stock ETF or otherwise). We all need to think for ourselves when it comes to trading our own accounts. First, it is the only way to really learn. Second, we are the only ones responsible for our decisions. Think of these charts as food for further analysis. Before making a trade, it is important to have a plan. Plan the trade and trade the plan. Among other things, this includes setting a trigger level, a target area and a stop-loss level. It is also important to plan for three possible price movements: advance, decline or sideways. Have a plan for all three scenarios BEFORE making the trade. Consider possible holding times. And finally, look at overall market conditions and sector/industry performance.


