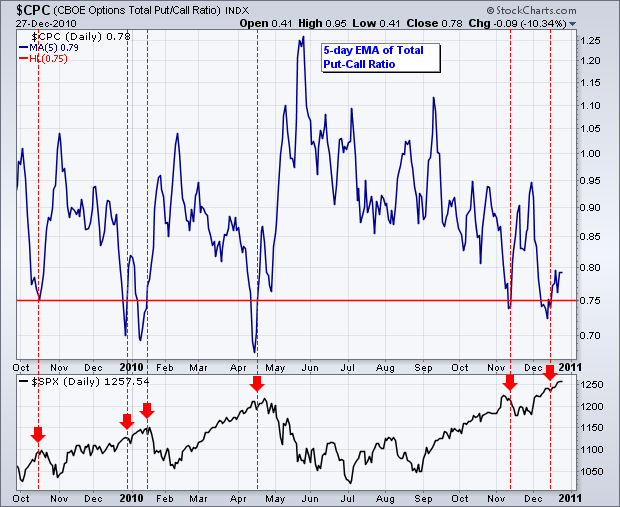
There is no real change in the short-term or medium-term situation. Even though some sentiment indicators show excessive bullishness, SPY remains in a clear uptrend on the 60-minute chart and the daily chart. The chart below shows the 5-day EMA for the CBOE Total Put/Call Ratio ($CPC). A move below .75 shows excessive bullishness among option players. The ratio is below 1 when call volume is greater than put volume. The red dotted lines show this 5-day EMA rising back above .75 six times in the last 15 months. These crossovers foreshadowed pullbacks in the S&P 500 four times. December 2009 marked one exception as the S&P 500 moved higher into January 2010. This indicator also moved below .75 in December 2010, but the S&P 500 continued higher. Recent history suggests that December extremes may not manifest themselves until January.
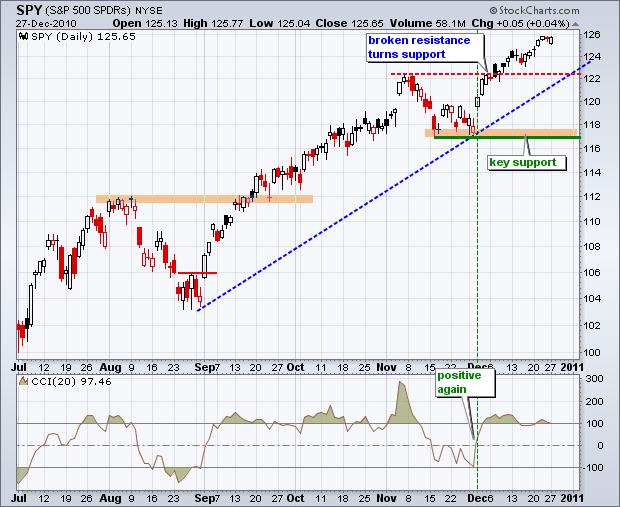
There is no change on the daily chart. The uptrend and Santa Claus rally propelled the S&P 500 ETF (SPY) to a new 2010 high last week. Once again, the tape rules the roost. Broken resistance from the November high turns into first support and this area is confirmed by the late August trendline. Momentum is bullish with CCI firmly in positive territory. Key support on the daily chart is based on the November lows around 117.

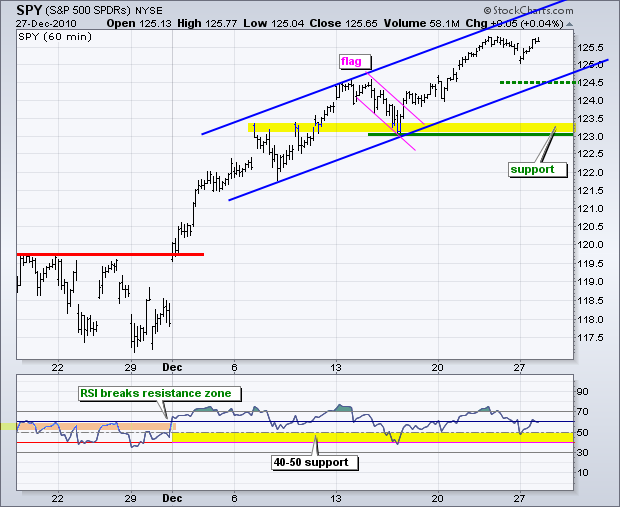
On the 60-minute chart, SPY broke flag resistance and worked its way higher the last two weeks. A rising channel of sorts is taking shape with channel support in the 124.5 area. A break below this level and an RSI cross below 40 would be negative. For now, I am leaving key support at 123 because dips just seem to attract buyers. SPY gapped down on the open Monday and then rallied to close near the high of the day. A dip into the 123-124 area may attract buyers again to forge a reaction low and new support level to watch.

Key Economic Reports:
Tue - Dec 28 - 09:00 - Case-Shiller 20-city Index
Wed - Dec 29 - 07:00 - MBA Mortgage Applications
Wed - Dec 29 - 10:30 - Oil Inventories
Thu - Dec 30 - 08:30 - Jobless Claims
Thu - Dec 30 - 09:45 - Chicago PMI
Thu - Dec 30 - 10:00 - Pending Home Sales
Charts of Interest: Tuesday and Thursday in separate post.
-----------------------------------------------------------------------------
This commentary and charts-of-interest are designed to stimulate thinking. This analysis is not a recommendation to buy, sell, hold or sell short any security (stock ETF or otherwise). We all need to think for ourselves when it comes to trading our own accounts. First, it is the only way to really learn. Second, we are the only ones responsible for our decisions. Think of these charts as food for further analysis. Before making a trade, it is important to have a plan. Plan the trade and trade the plan. Among other things, this includes setting a trigger level, a target area and a stop-loss level. It is also important to plan for three possible price movements: advance, decline or sideways. Have a plan for all three scenarios BEFORE making the trade. Consider possible holding times. And finally, look at overall market conditions and sector/industry performance.

