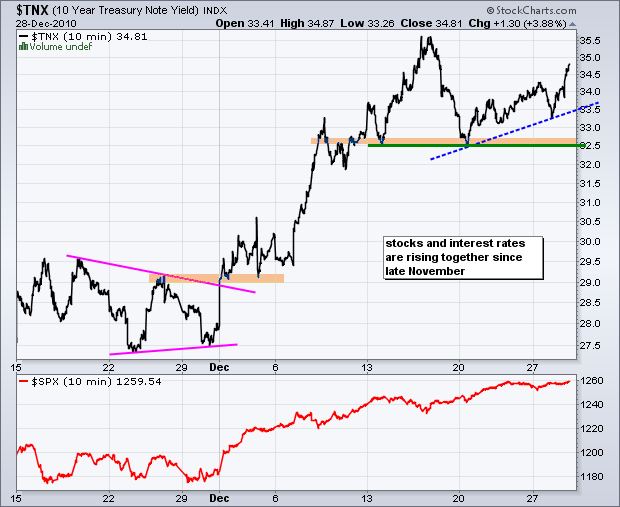
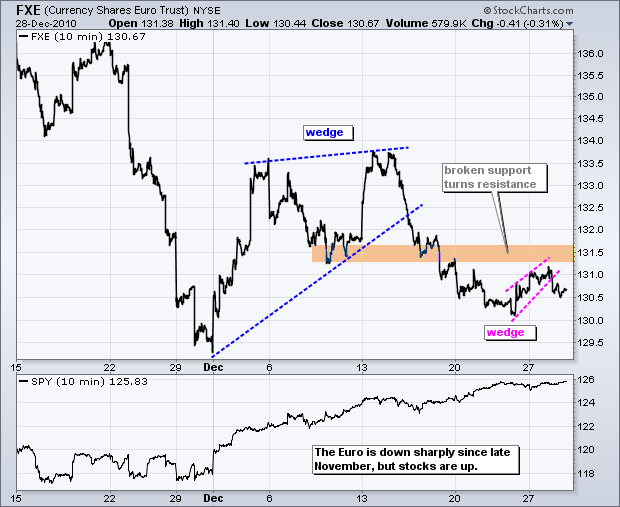
Rising interest rates are a plus for the greenback. After a pullback in mid December, interest rates resumed their upward trajectory as the 10-year Treasury Yield ($TNX) surged above 3.45% on Tuesday. Rising interest rates are bullish for both the Dollar and the stock market. Rates rise when the prospects for the economy improve. The bond market is also pricing in a change in Fed policy in 2011. Yes, it looks like the Fed will shift to either a neutral bias or a tightening bias in the first half of 2011. Rising interest rates and an improving economy are also bullish for the Dollar. First, higher interest rates make Dollar denominated bonds more attractive. Second, a strengthening economy means more demand for Dollars as money finds its way into US assets. The second chart shows the Euro Currency Trust (FXE) hitting resistance from broken support and forming a rising flag/wedge. The ETF broke wedge support with yesterday's decline. Holiday Note: Art's Charts will be on vacation Thursday-Friday and return on Monday, January 3rd. Happy New Year!


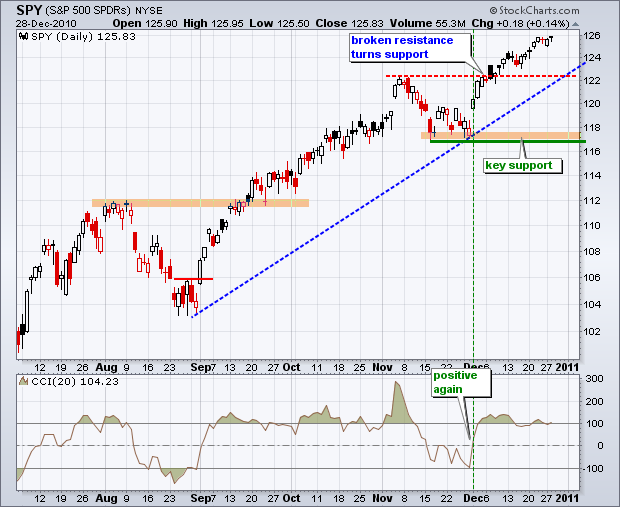
There is no change on the daily chart. The uptrend and Santa Claus rally propelled the S&P 500 ETF (SPY) to a new 2010 high last week. Once again, the tape rules the roost. Broken resistance from the November high turns into first support and this area is confirmed by the late August trendline. Momentum is bullish with CCI firmly in positive territory. Key support on the daily chart is based on the November lows around 117.

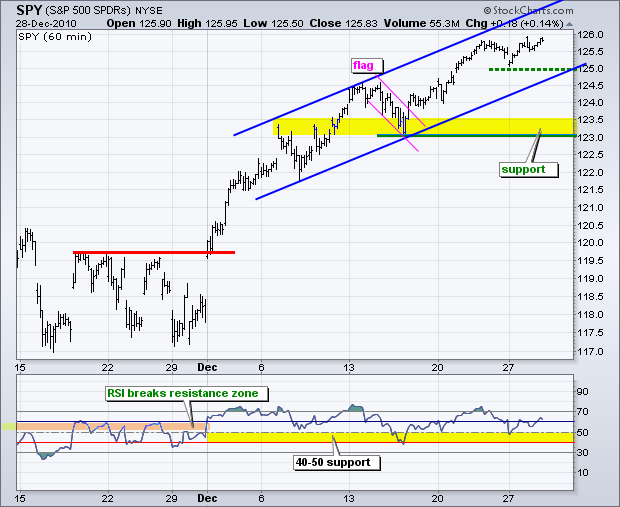
On the 60-minute chart, SPY broke flag resistance and worked its way higher the last two weeks. A rising channel of sorts is taking shape with channel support in the 124.5 area. A break below this level and an RSI cross below 40 would be negative. For now, I am leaving key support at 123 because dips just seem to attract buyers. SPY gapped down on the open Monday and then rallied to close near the high of the day. A dip into the 123-124 area may attract buyers again to forge a reaction low and new support level to watch.

Key Economic Reports:
Wed - Dec 29 - 07:00 - MBA Mortgage Applications
Wed - Dec 29 - 10:30 - Oil Inventories
Thu - Dec 30 - 08:30 - Jobless Claims
Thu - Dec 30 - 09:45 - Chicago PMI
Thu - Dec 30 - 10:00 - Pending Home Sales
Charts of Interest: Tuesday and Thursday in separate post.
-----------------------------------------------------------------------------
This commentary and charts-of-interest are designed to stimulate thinking. This analysis is not a recommendation to buy, sell, hold or sell short any security (stock ETF or otherwise). We all need to think for ourselves when it comes to trading our own accounts. First, it is the only way to really learn. Second, we are the only ones responsible for our decisions. Think of these charts as food for further analysis. Before making a trade, it is important to have a plan. Plan the trade and trade the plan. Among other things, this includes setting a trigger level, a target area and a stop-loss level. It is also important to plan for three possible price movements: advance, decline or sideways. Have a plan for all three scenarios BEFORE making the trade. Consider possible holding times. And finally, look at overall market conditions and sector/industry performance.


