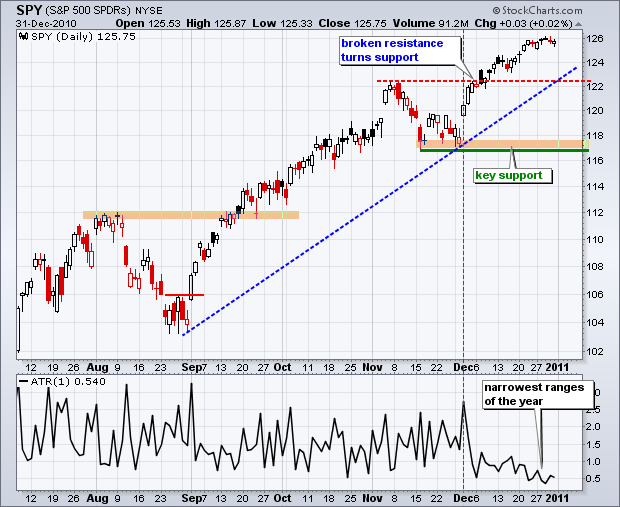
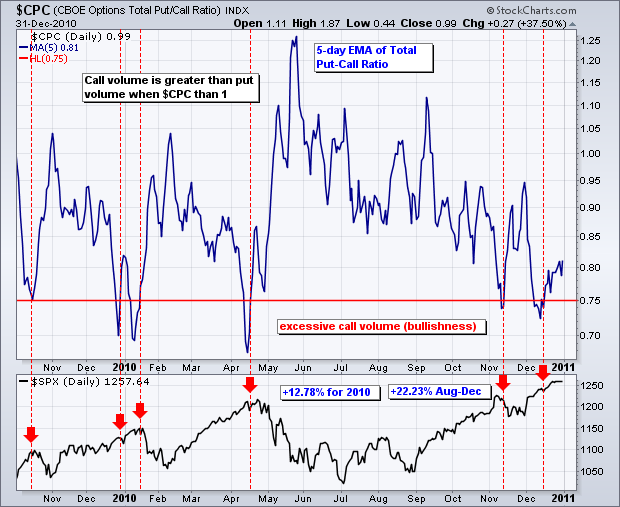
Even though sentiment is excessively bullish and stocks are ripe for a pullback, the major index ETFs simply show no signs of selling pressure and remain strong overall. The CBOE Total Put/Call Ratio ($CPC) dipped below .75 in mid December to show excessive bullishness, but this did not stop the December rally. For the month, the S&P 500 was up 6.53%, the Russell 2000 was up 7.79% and the Nasdaq was up 6.19%. These are big gains on top of already big gains from September to November. The S&P 500 was up 17.22% from September 1st to November 30th. Put it all together and the S&P 500 was up 22.23% the last four months of the year. The third quarter made 2010 a winning year as the S&P 500 went from a modest year-to-date loss in late August to a nice year-to-date gain by the end of December (+12.78%). Returning to sentiment, the CBOE Total Put/Call Ratio was a couple weeks early at the end of 2009 and a week early in August 2010. Sentiment indicators provide warnings, but are not great for timing. Chartists must turn to the actual price charts for timing.

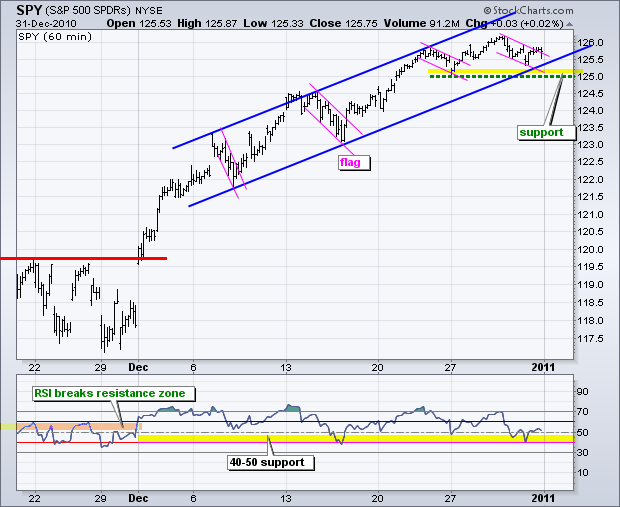
On the 60-minute chart, SPY moved above 125.5 on 25-Dec and fluctuated around this level the next six days. A number of small flag pullbacks formed within the channel. There was one last week and SPY edged above the flag trendline on Friday. This mini-breakout argues for a move higher to start the year. The channel trendline and reaction lows established short-term support around 125. A break below this level would provide the first signs of weakness. I am also watching RSI support in the 40-50 zone. A break below this zone would turn short-term momentum bearish.

Key Economic Reports:
Mon - Jan 03 - 10:00 - Construction Spending
Mon - Jan 03 - 10:00 - ISM Index
Tue - Jan 04 - 10:00 - Factory Orders
Tue - Jan 04 - 14:00 - FOMC Minutes
Tue - Jan 04 - 15:00 - Auto-Truck Sales
Wed - Jan 05 - 07:00 - MBA Mortgage Purchase Index
Wed - Jan 05 - 08:15 - ADP Employment Change
Wed - Jan 05 - 10:00 - ISM Services
Wed - Jan 05 - 10:30 - Oil Inventories
Thu - Jan 06 - 08:30 - Jobless Claims
Fri - Jan 07 - 08:30 - Nonfarm Payrolls – Employment Report
Fri - Jan 07 - 10:00 – Bernanke Speaks
Charts of Interest: Tuesday and Thursday in separate post.
-----------------------------------------------------------------------------
This commentary and charts-of-interest are designed to stimulate thinking. This analysis is not a recommendation to buy, sell, hold or sell short any security (stock ETF or otherwise). We all need to think for ourselves when it comes to trading our own accounts. First, it is the only way to really learn. Second, we are the only ones responsible for our decisions. Think of these charts as food for further analysis. Before making a trade, it is important to have a plan. Plan the trade and trade the plan. Among other things, this includes setting a trigger level, a target area and a stop-loss level. It is also important to plan for three possible price movements: advance, decline or sideways. Have a plan for all three scenarios BEFORE making the trade. Consider possible holding times. And finally, look at overall market conditions and sector/industry performance.


