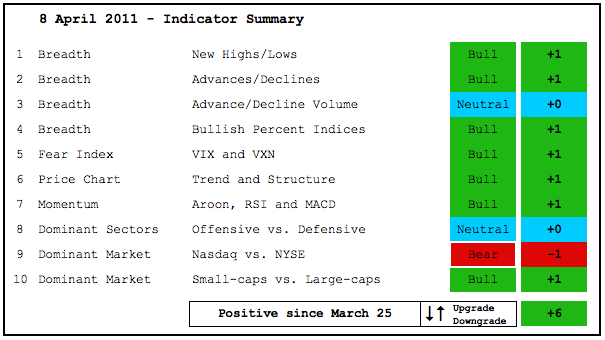
While there are some discrepancies out there with various indicators, the weight of the evidence clearly favors the bulls. The NYSE AD Line hit a new high this week. Net New Highs expanded on both the NYSE and the Nasdaq. Small-caps are outperforming large-caps. Three of the five major index ETFs exceeded their February highs recently. Overbought conditions, excessive sentiment readings and low volume may be overhanging this uptrend, but these negatives are outweighed by the positives in breadth and price trend. See the About Page for more on Art's Charts and this indicator summary.
This table is designed to offer an objective look at current market conditions. It does not aim to pick tops or bottoms. Instead, it seeks to identify noticeable shifts in buying and selling pressure. With 10 indicator groups, the medium-term evidence is unlikely to change drastically overnight.

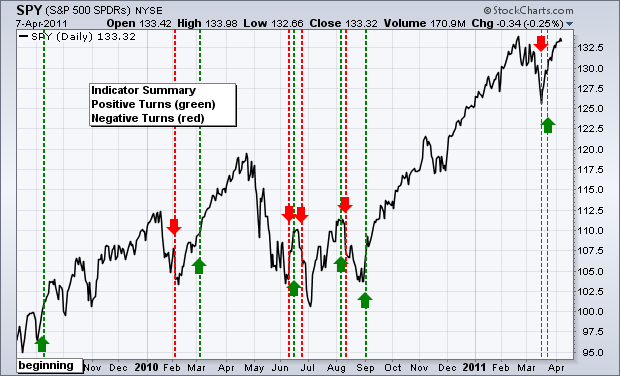
Previous turns include:
Positive on 11-Sept-09
Negative on 5-Feb-10
Positive on 5-March-10
Negative on 11-Jun-10
Positive on 18-Jun-10
Negative on 24-Jun-10
Positive on 6-Aug-10
Negative on 13-Aug-10
Positive on 3-Sep-10
Negative on 18-Mar-11
Positive on 25-Mar-11


