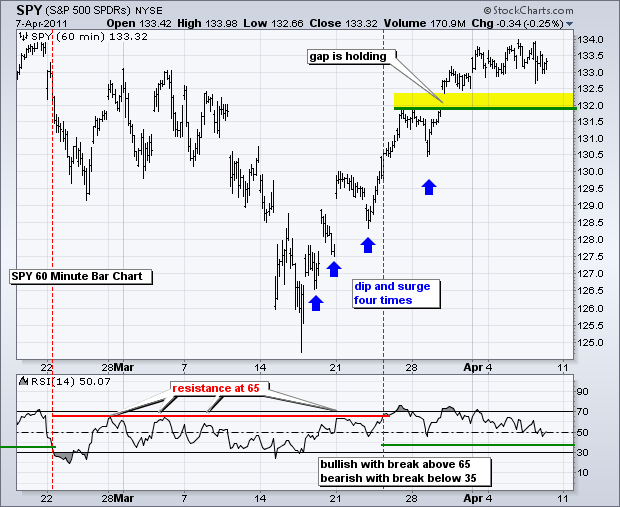
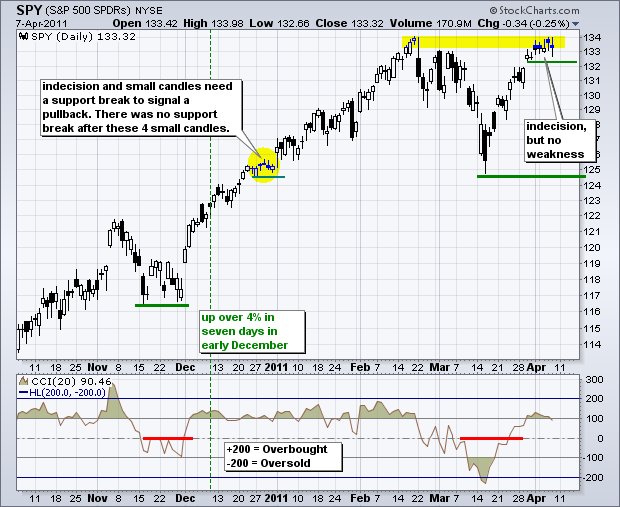
Bonds are breaking down and this is bullish for stocks. Stocks and bonds have been inversely correlated for some time now. Even though US interest rates are rising, the Dollar is falling and this is putting a bid into commodities. Strength in stocks is also helping commodities. These two have been positively correlated for well over a year. In short, the underlying trends remain firmly in place. Stocks are trending up, bonds are trending down, commodities are trending up and the Dollar is trending down. Indicators outside the price chart are flashing warning signs, but the price chart (aka trend) is having none of it. Who's your daddy? The price chart. SPY continues its stall with seven indecisive candlesticks in the last seven days. This may just be the rest that refreshes. QQQ appears to be forming a small falling (bull) flag the last five days.

Key Economic Reports/Events:
Fri - Apr 08 - 10:00 – TGIF! Wholesale Inventories
Charts of Interest: Tuesday and Thursday in separate post.
-----------------------------------------------------------------------------
This commentary and charts-of-interest are designed to stimulate thinking. This analysis is not a recommendation to buy, sell, hold or sell short any security (stock ETF or otherwise). We all need to think for ourselves when it comes to trading our own accounts. First, it is the only way to really learn. Second, we are the only ones responsible for our decisions. Think of these charts as food for further analysis. Before making a trade, it is important to have a plan. Plan the trade and trade the plan. Among other things, this includes setting a trigger level, a target area and a stop-loss level. It is also important to plan for three possible price movements: advance, decline or sideways. Have a plan for all three scenarios BEFORE making the trade. Consider possible holding times. And finally, look at overall market conditions and sector/industry performance.


