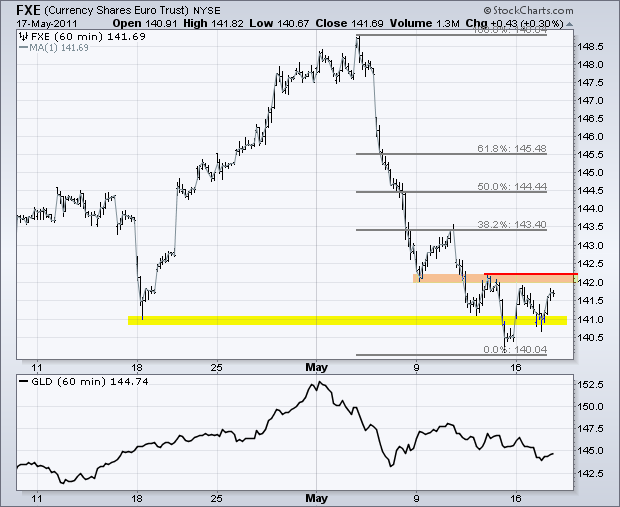
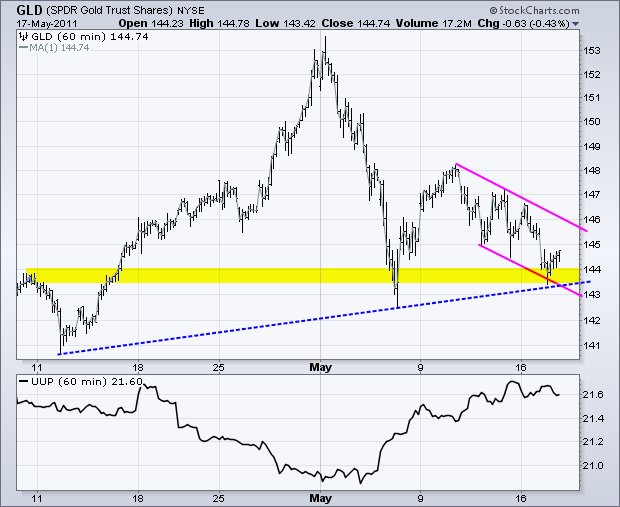
The Gold SPDR (GLD) is at support and looks ripe for an oversold bounce. The mid April trendline, broken resistance and the early May spike low mark support in the 144 area. A falling channel defines the short-term downtrend. Look for a surge off support for the first bullish sign. A follow through break above channel resistance would argue for further strength in bullion. Selling pressure may be less now that Soros has sold all his gold holdings. This may be like the bond rally after Bill Gross announced that PIMCO had sold all US Treasuries. Also notice that gold and the Dollar were inversely correlated the last 4-5 weeks. A bounce in gold should also be accompanied by weakness in the Dollar or strength in the Euro.

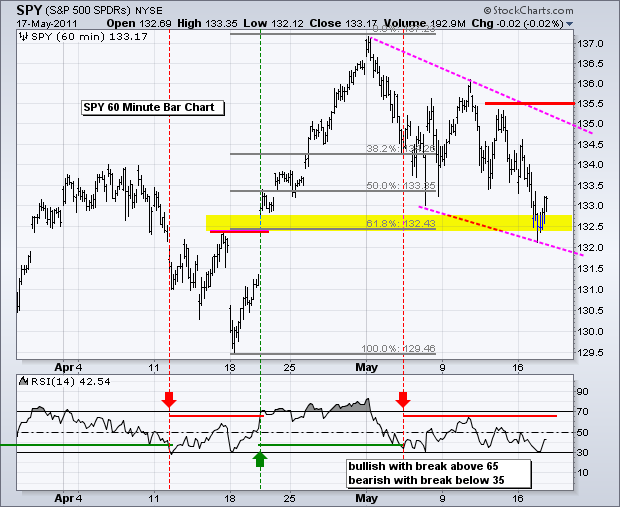
Stocks weakened this month with the return of the risk-off trade. A flight from risky assets is bullish for the Dollar and bonds, but bearish for stocks, oil and the Euro. Even though the S&P 500 ETF (SPY) remains bearish short-term, oversold bounces in the Euro and gold could pave the way for an oversold bounce in stocks. This means SPY could bounce to the 134 area. Also note that the ETF is trading at potential support from the 62% retracement and late April breakout. The decline over the last few weeks traced out a falling wedge. Technically, the short-term trend would not reverse unless SPY takes out resistance at 135.5 and RSI breaks above 65.

Key Economic Reports/Events:
Wed - May 18 - 07:00 - MBA Mortgage Index
Wed - May 18 - 10:30 - Oil Inventories
Wed - May 18 - 14:00 - FOMC Minutes
Thu - May 19 - 08:30 - Jobless Claims
Thu - May 19 - 10:00 - Existing Home Sales
Thu - May 19 - 10:00 - Philadelphia Fed
Thu - May 19 - 10:00 - Leading Indicators
Charts of Interest: Tuesday and Thursday in separate post.
***********************************************
This commentary and charts-of-interest are designed to stimulate thinking. This analysis is not a recommendation to buy, sell, hold or sell short any security (stock ETF or otherwise). We all need to think for ourselves when it comes to trading our own accounts. First, it is the only way to really learn. Second, we are the only ones responsible for our decisions. Think of these charts as food for further analysis. Before making a trade, it is important to have a plan. Plan the trade and trade the plan. Among other things, this includes setting a trigger level, a target area and a stop-loss level. It is also important to plan for three possible price movements: advance, decline or sideways. Have a plan for all three scenarios BEFORE making the trade. Consider possible holding times. And finally, look at overall market conditions and sector/industry performance.


