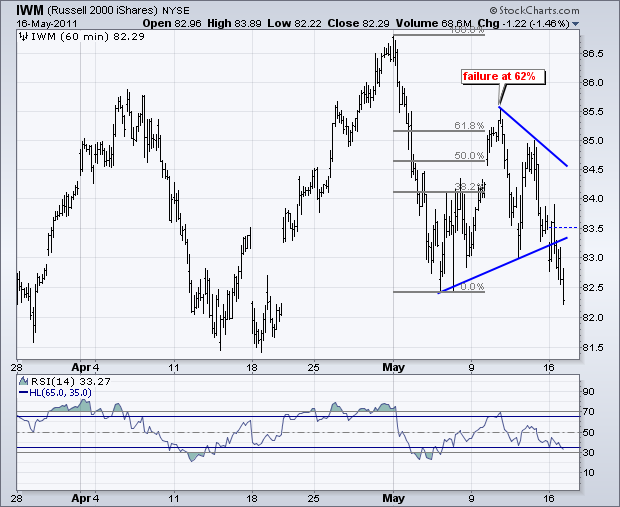
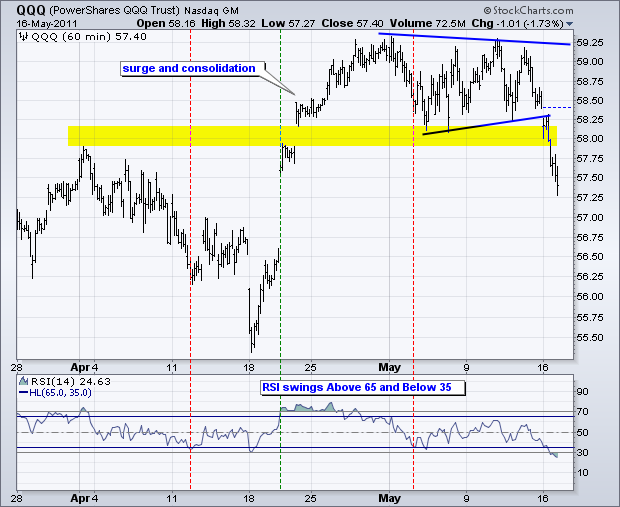
Most of the action on Monday took place outside of the S&P 500 ETF (SPY). In particular, the Nasdaq 100 ETF (QQQ) broke support with a sharp decline led by large-cap tech stocks. Apple (AAPL) and Google were down over 2% and Amazon (AMZN) was down almost 5%. The chart below shows QQQ breaking triangle support and moving below its early May low. With this move below 58, the late April breakout failed to hold. RSI confirmed the support break with a move below 35 for the third time this month. RSI is clearly in bear mode with resistance at 65. Monday's breakdown in QQQ is bearish and relative weakness in large techs could have ramifications for the broader market. Broken support around 58 now turns into the first resistance level to watch.

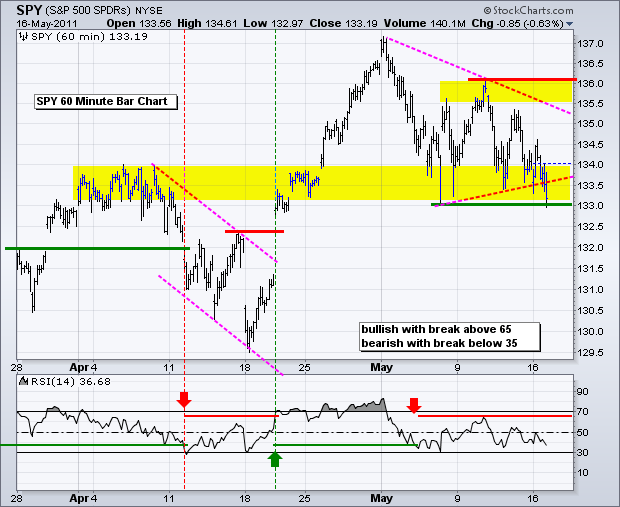
The S&P 500 ETF (SPY) held up better than small-caps and large-techs during the day, but succumbed to selling pressure in the afternoon. A small gain in the Healthcare sector and a small loss in the Finance sector kept SPY from posting a bigger loss. The ETF broke the lower trendline of the triangle and is currently testing the lower end of its support zone at 133. As noted before, RSI moved into bear mode after breaking below 35 in early May and failing at bear-zone resistance (65) last week.

Key Economic Reports/Events:
Tue - May 17 - 08:30 - Housing Starts/Building Permit
Tue - May 17 - 09:15 - Industrial Production
Wed - May 18 - 07:00 - MBA Mortgage Index
Wed - May 18 - 10:30 - Oil Inventories
Wed - May 18 - 14:00 - FOMC Minutes
Thu - May 19 - 08:30 - Jobless Claims
Thu - May 19 - 10:00 - Existing Home Sales
Thu - May 19 - 10:00 - Philadelphia Fed
Thu - May 19 - 10:00 - Leading Indicators
Charts of Interest: Tuesday and Thursday in separate post.
***********************************************
This commentary and charts-of-interest are designed to stimulate thinking. This analysis is not a recommendation to buy, sell, hold or sell short any security (stock ETF or otherwise). We all need to think for ourselves when it comes to trading our own accounts. First, it is the only way to really learn. Second, we are the only ones responsible for our decisions. Think of these charts as food for further analysis. Before making a trade, it is important to have a plan. Plan the trade and trade the plan. Among other things, this includes setting a trigger level, a target area and a stop-loss level. It is also important to plan for three possible price movements: advance, decline or sideways. Have a plan for all three scenarios BEFORE making the trade. Consider possible holding times. And finally, look at overall market conditions and sector/industry performance.


