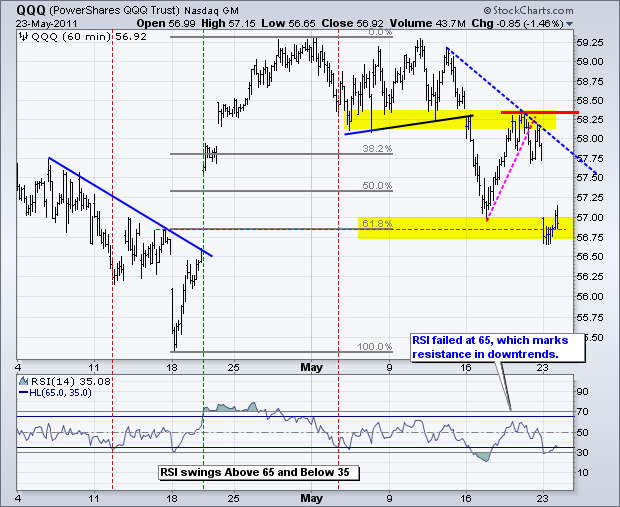
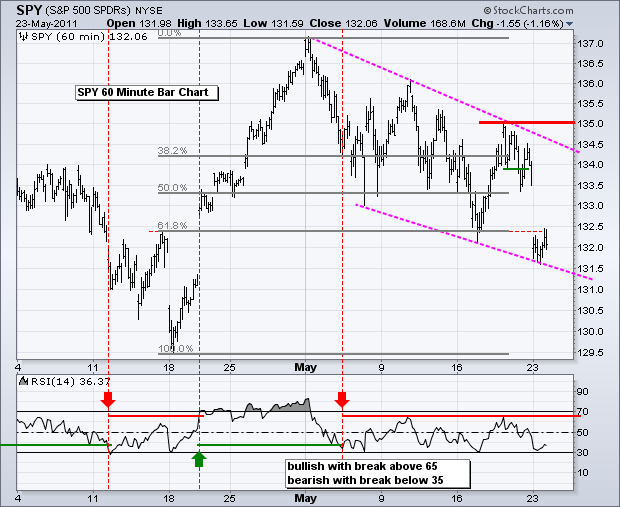
With big gaps and sharp declines, the major index ETFs became oversold within short-term downtrends. This is a tricky situation because the medium-term trends (daily charts) remain up. The May decline, while sharp, is still viewed as a correction within a bigger uptrend. Picking the bottom for this correction is, of course, the $64,000 question. Of note, stocks gapped down on Monday morning and then traded sideways the rest of the days. There was not much selling pressure after the gap. Nevertheless, the gaps remain and filling these gaps is the first step to a short-term trend reversal. At this point, a few days are likely needed to let the dust settle and a new setup to unfold. The first chart shows the Nasdaq 100 ETF (QQQ) gapping down and firming after the gap. Notice that QQQ firmed near the 62% retracement and the mid April breakout.


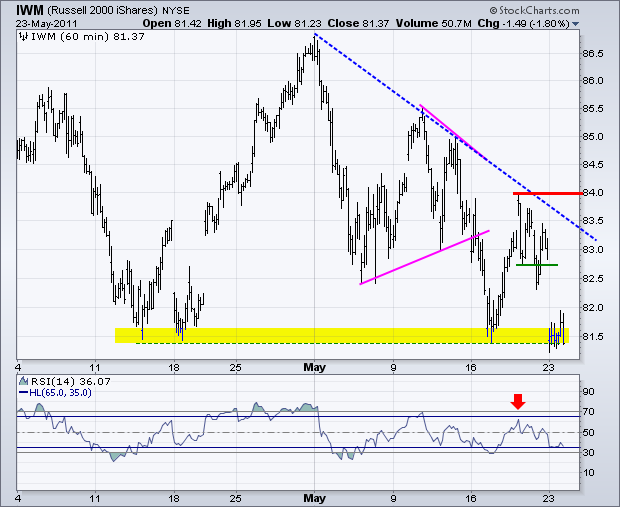
The Russell 2000 ETF (IWM) broke below its April-May lows with a decline below 81.40 on Monday. Despite this break, the ETF did manage to firm in the 81.5 area and there is still potential support here. Keep in mind that it is best to use support or resistance zone when dealing with index-based ETFs.

Key Economic Reports/Events:
Tue - May 24 10:00 New Home Sales
Wed - May 25 07:00 MBA Mortgage Index
Wed - May 25 08:30 Durable Orders
Wed - May 25 10:30 Crude Inventories
Thu - May 26 08:30 GDP - Second Estimate
Thu - May 26 08:30 Initial Claims
Fri - May 27 08:30 Personal Income & Spending
Fri - May 27 09:55 Michigan Sentiment
Fri - May 27 10:00 Pending Home Sales
Charts of Interest: Tuesday and Thursday in separate post.
***********************************************
This commentary and charts-of-interest are designed to stimulate thinking. This analysis is not a recommendation to buy, sell, hold or sell short any security (stock ETF or otherwise). We all need to think for ourselves when it comes to trading our own accounts. First, it is the only way to really learn. Second, we are the only ones responsible for our decisions. Think of these charts as food for further analysis. Before making a trade, it is important to have a plan. Plan the trade and trade the plan. Among other things, this includes setting a trigger level, a target area and a stop-loss level. It is also important to plan for three possible price movements: advance, decline or sideways. Have a plan for all three scenarios BEFORE making the trade. Consider possible holding times. And finally, look at overall market conditions and sector/industry performance.


