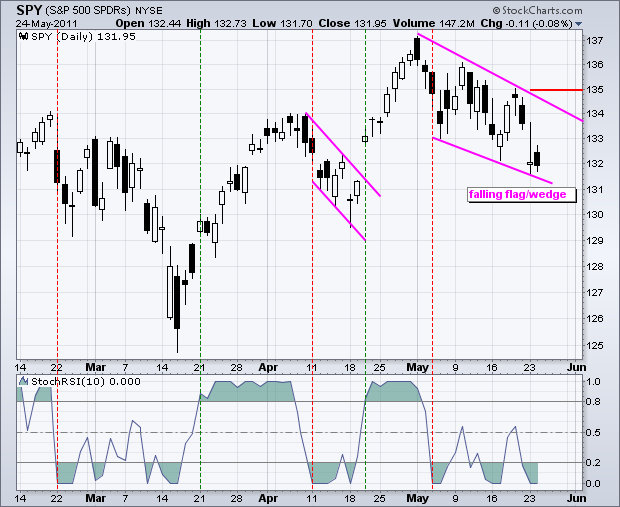
After recording a fresh 52-week high four weeks ago, SPY declined in May and formed a falling flag or wedge. First, 52-week highs occur in uptrends, not downtrends. Second, SPY remains above the mid April reaction low and has yet to forge a lower low. Downtrends require lower lows. Third, falling flags are bullish corrective patterns. According to classic technical analysis, bearish flags rise and bullish flags fall. In other words, a falling flag is viewed as correction within a bigger uptrend. Technically, the short-term trend is down as long as this flag/wedge falls. A break above 135 is needed to reverse this downtrend and signal a resumption of the larger uptrend. Entertaining ideas of a medium-term downtrend are premature until SPY breaks below the mid April low.
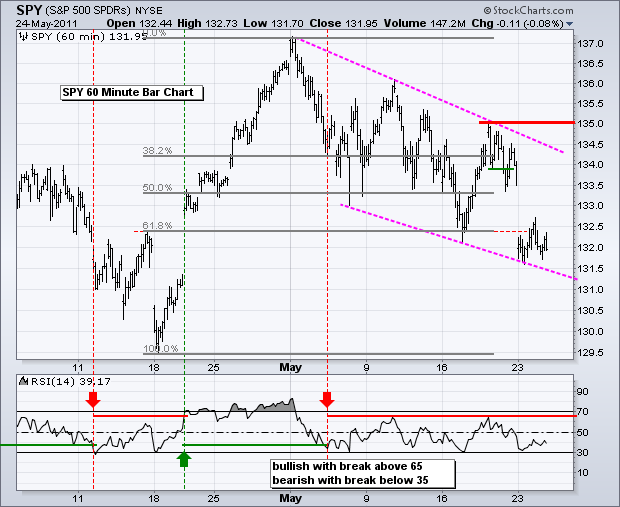
The 60-minute chart expands on the falling flag/wedge. SPY gapped down on Monday and firmed after the gap. Notice how the ETF traded around 132 the last two days. Firming is one thing. Strength is another. As noted yesterday, I think we need a few more days for the dust to settle before a better setup emerges. An oversold-bounce or mean-reversion trade is the only setup currently in the works. A short-term trend reversal requires SPY to break 135 and RSI to break 65.

Key Economic Reports/Events:
Wed - May 25 07:00 MBA Mortgage Index
Wed - May 25 08:30 Durable Orders
Wed - May 25 10:30 Crude Inventories
Thu - May 26 08:30 GDP - Second Estimate
Thu - May 26 08:30 Initial Claims
Fri - May 27 08:30 Personal Income & Spending
Fri - May 27 09:55 Michigan Sentiment
Fri - May 27 10:00 Pending Home Sales
Charts of Interest: Tuesday and Thursday in separate post.
***********************************************
This commentary and charts-of-interest are designed to stimulate thinking. This analysis is not a recommendation to buy, sell, hold or sell short any security (stock ETF or otherwise). We all need to think for ourselves when it comes to trading our own accounts. First, it is the only way to really learn. Second, we are the only ones responsible for our decisions. Think of these charts as food for further analysis. Before making a trade, it is important to have a plan. Plan the trade and trade the plan. Among other things, this includes setting a trigger level, a target area and a stop-loss level. It is also important to plan for three possible price movements: advance, decline or sideways. Have a plan for all three scenarios BEFORE making the trade. Consider possible holding times. And finally, look at overall market conditions and sector/industry performance.


