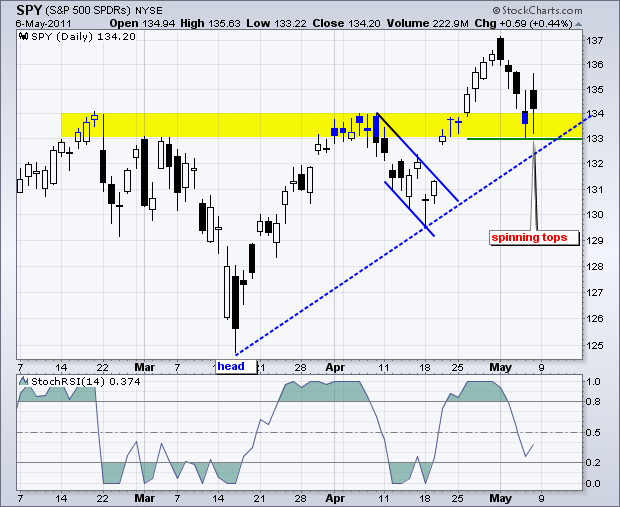
SPY declined to support and firmed with two spinning tops at the end of the week. These candlesticks have relatively long shadows with a small body. The shadows represent the high and low, while the body represents the open and close. Even though SPY firmed with these spinning tops, we can also see that all five candlesticks from last week are black or filled. This means the close was below the open every day last week. Despite strong opens on Monday and Friday, SPY moved lower during the day and closed below the open. Selling pressure was quite intense last week and did not let up much on Friday. Nevertheless, support is at hand and SPY is trying to make a stand. Support has been affirmed at 133 with the Thursday-Friday lows and the trendline extending up from the March low. A break below 133 would put SPY into the gap zone and undermine the late April resistance breakout.

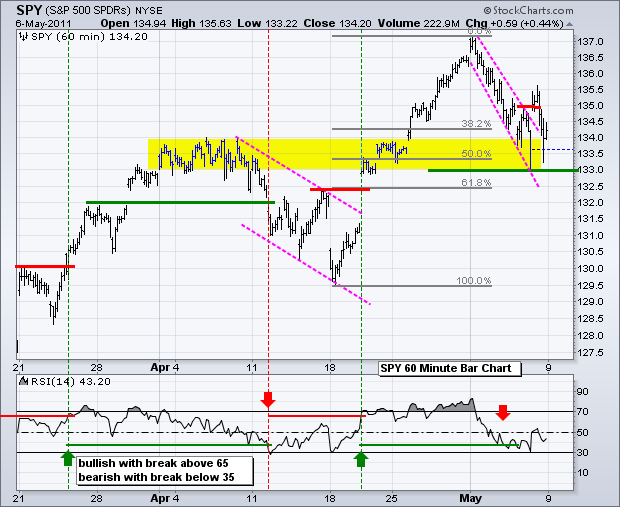
On the 60-minute chart, SPY broke above short-term resistance with a surge above 135 on the open, but fell back during the day and failed to hold the breakout. This failed breakout negative, but support is still holding and the SPY managed to hold support on Friday. A renewed move above 135 would revive this breakout. A break below support at 133 would put the bears back in the driver's seat.

Key Economic Reports/Events:
Wed - May 11 - 07:00 - MBA Mortgage Index
Wed - May 11 - 10:30 - Oil Inventories
Thu - May 12 - 08:30 - Jobless Claims
Thu - May 12 - 08:30 - Producer Price Index (PPI)
Thu - May 12 - 08:30 - Retail Sales
Thu - May 12 - 10:00 - Business Inventories
Fri - May 13 - 08:30 - Consumer Price Index (CPI)
Fri - May 13 - 09:55 - Michigan Sentiment
Charts of Interest: Tuesday and Thursday in separate post.
***********************************************
This commentary and charts-of-interest are designed to stimulate thinking. This analysis is not a recommendation to buy, sell, hold or sell short any security (stock ETF or otherwise). We all need to think for ourselves when it comes to trading our own accounts. First, it is the only way to really learn. Second, we are the only ones responsible for our decisions. Think of these charts as food for further analysis. Before making a trade, it is important to have a plan. Plan the trade and trade the plan. Among other things, this includes setting a trigger level, a target area and a stop-loss level. It is also important to plan for three possible price movements: advance, decline or sideways. Have a plan for all three scenarios BEFORE making the trade. Consider possible holding times. And finally, look at overall market conditions and sector/industry performance.


