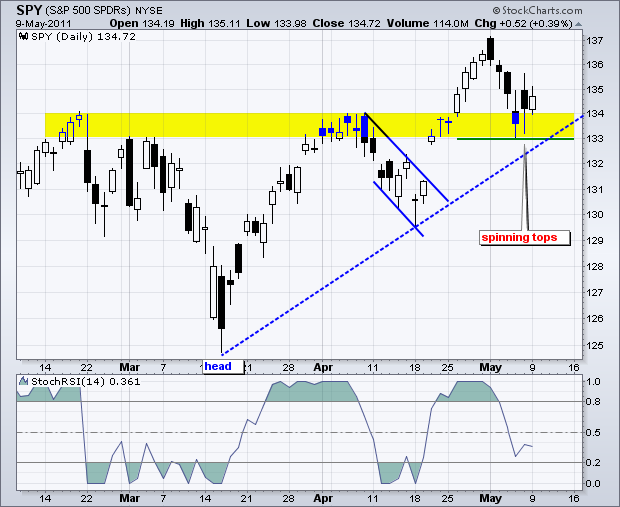
There is no real change on the daily chart as SPY continues to firm at broken resistance, which turns into support. The ETF formed two spinning tops on Thursday-Friday and a small white candlestick on Monday. The bounce was rather feeble, but support is holding nonetheless. So far the breakout remains valid and has yet to be proven otherwise (failed). A move below 133 would throw cold water on the breakout. While this would be short-term bearish, it would still not be enough to affect the medium-term uptrend. I am marking key medium-term support at 129, the mid April low.
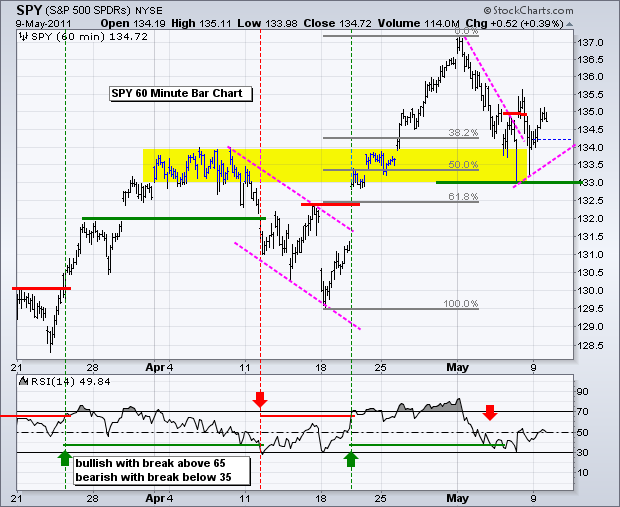
On the 60-minute chart, SPY fell back after last week's resistance breakout at 135, but has yet to break support at 133. This is a tricky situation for both bulls and bearish. Support at 133-134 should hold because the medium-term trend is up. I am, however, concerned, that SPY could simply be consolidating in preparation for another short-term leg lower. The trendline extending up from last week's low marks the first support level to watch at 134. A break below this level would make the Thursday-Monday range a consolidation and signal a continuation of last week's decline.

Key Economic Reports/Events:
Wed - May 11 - 07:00 - MBA Mortgage Index
Wed - May 11 - 10:30 - Oil Inventories
Thu - May 12 - 08:30 - Jobless Claims
Thu - May 12 - 08:30 - Producer Price Index (PPI)
Thu - May 12 - 08:30 - Retail Sales
Thu - May 12 - 10:00 - Business Inventories
Fri - May 13 - 08:30 - Consumer Price Index (CPI)
Fri - May 13 - 09:55 - Michigan Sentiment
Charts of Interest: Tuesday and Thursday in separate post.
***********************************************
This commentary and charts-of-interest are designed to stimulate thinking. This analysis is not a recommendation to buy, sell, hold or sell short any security (stock ETF or otherwise). We all need to think for ourselves when it comes to trading our own accounts. First, it is the only way to really learn. Second, we are the only ones responsible for our decisions. Think of these charts as food for further analysis. Before making a trade, it is important to have a plan. Plan the trade and trade the plan. Among other things, this includes setting a trigger level, a target area and a stop-loss level. It is also important to plan for three possible price movements: advance, decline or sideways. Have a plan for all three scenarios BEFORE making the trade. Consider possible holding times. And finally, look at overall market conditions and sector/industry performance.

About the author:
Arthur Hill, CMT, is the Chief Technical Strategist at TrendInvestorPro.com. Focusing predominantly on US equities and ETFs, his systematic approach of identifying trend, finding signals within the trend, and setting key price levels has made him an esteemed market technician. Arthur has written articles for numerous financial publications including Barrons and Stocks & Commodities Magazine. In addition to his Chartered Market Technician (CMT) designation, he holds an MBA from the Cass Business School at City University in London.
Learn More


