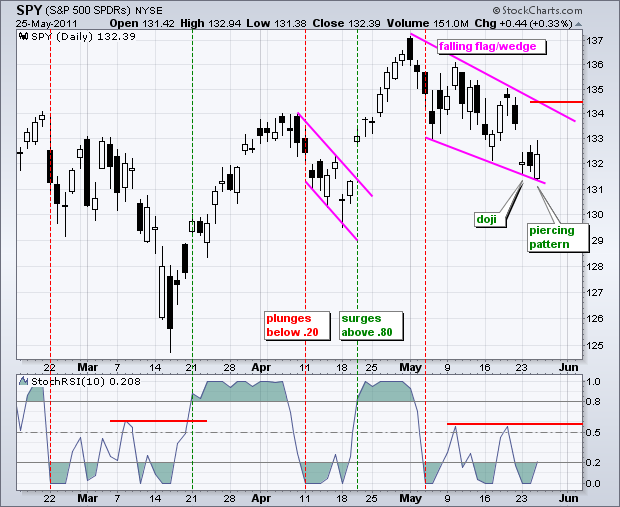
There is no real change on the charts as SPY continues to firm after Monday's gap down. The ETF formed a doji on Monday, which indicates indecision. After a weak open on Wednesday, SPY recovered and closed above 132 to form a white candlestick that closed above the mid point of the prior black body (open-close range). Technically, a piercing pattern formed, which is a bullish candlestick reversal. Overall, the short-term trend is down as SPY trades within a falling flag or wedge this month. While the doji and piercing pattern point to an oversold bounce within this downtrend, I was not impressed with yesterday's final hour, sector participation or breadth. SPY did not finish strong on Wednesday as selling pressure pushed the ETF lower in the final 30 minutes. The Finance SPDR (XLF) and the Consumer Discretionary SPDR (XLY) were largely unchanged on the day. These two key sectors were noticeably absent from yesterday's advance. Net Advancing Volume for both the Nasdaq and NYSE was uninspiring. At this point, I would not be surprised to see more choppy trading that frustrates both bulls and bears for the next few days.
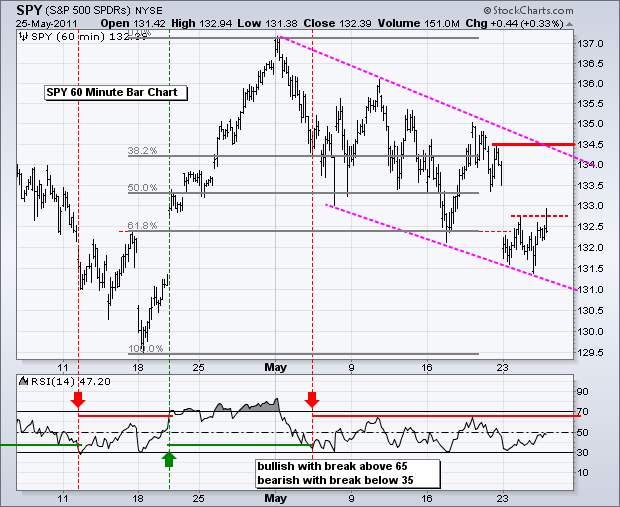
On the 60-minute chart, SPY continues to consolidate around the 132 area, which is just below the 62% retracement. The ETF tried to break above Tuesday's high, but failed to hold this mini-breakout and closed below 132.5. This little resistance level is the first to watch for signs of an oversold bounce. A complete trend reversal would require SPY to break 134.5 and RSI to break 65.

Key Economic Reports/Events:
Wed - May 25 07:00 MBA Mortgage Index
Wed - May 25 08:30 Durable Orders
Wed - May 25 10:30 Crude Inventories
Thu - May 26 08:30 GDP - Second Estimate
Thu - May 26 08:30 Initial Claims
Fri - May 27 08:30 Personal Income & Spending
Fri - May 27 09:55 Michigan Sentiment
Fri - May 27 10:00 Pending Home Sales
Charts of Interest: Tuesday and Thursday in separate post.
***********************************************
This commentary and charts-of-interest are designed to stimulate thinking. This analysis is not a recommendation to buy, sell, hold or sell short any security (stock ETF or otherwise). We all need to think for ourselves when it comes to trading our own accounts. First, it is the only way to really learn. Second, we are the only ones responsible for our decisions. Think of these charts as food for further analysis. Before making a trade, it is important to have a plan. Plan the trade and trade the plan. Among other things, this includes setting a trigger level, a target area and a stop-loss level. It is also important to plan for three possible price movements: advance, decline or sideways. Have a plan for all three scenarios BEFORE making the trade. Consider possible holding times. And finally, look at overall market conditions and sector/industry performance.


