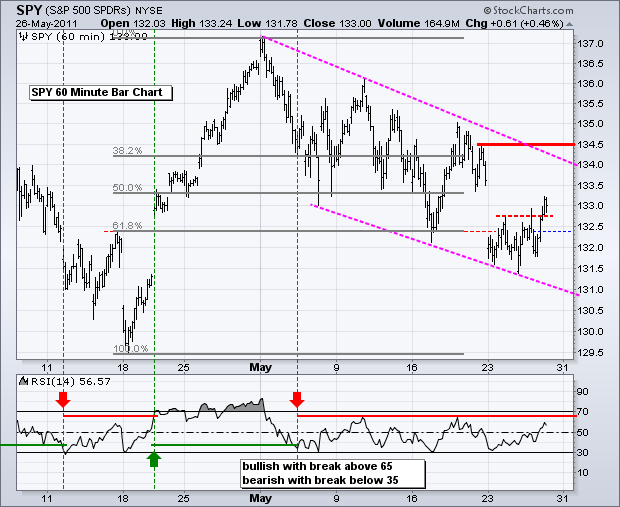
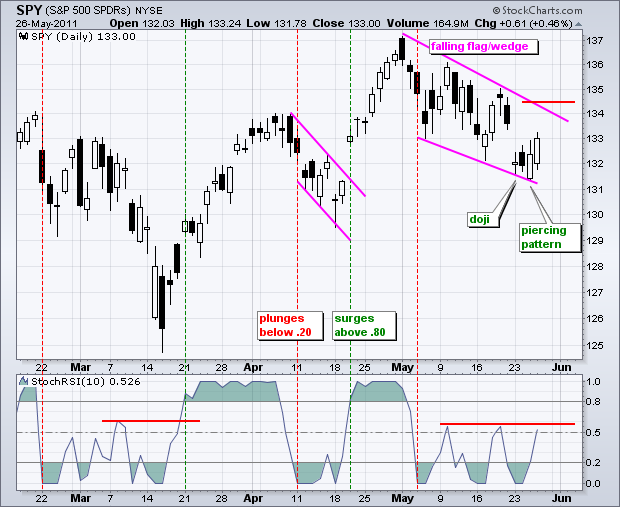
SPY followed through on the doji and piercing pattern with another modest gain on Thursday. The ETF closed up a mere .46%, but the white candlestick was once again rather long as SPY opened weak and closed fairly strong. So far, this looks like an oversold bounce within a downtrend defined by the falling flag/wedge. Monday's gap has yet to be completely filled and StochRSI remains below its prior highs.

Key Economic Reports/Events:
Fri - May 27 08:30 Personal Income & Spending
Fri - May 27 09:55 Michigan Sentiment
Fri - May 27 10:00 Pending Home Sales
Charts of Interest: Tuesday and Thursday in separate post.
***********************************************
This commentary and charts-of-interest are designed to stimulate thinking. This analysis is not a recommendation to buy, sell, hold or sell short any security (stock ETF or otherwise). We all need to think for ourselves when it comes to trading our own accounts. First, it is the only way to really learn. Second, we are the only ones responsible for our decisions. Think of these charts as food for further analysis. Before making a trade, it is important to have a plan. Plan the trade and trade the plan. Among other things, this includes setting a trigger level, a target area and a stop-loss level. It is also important to plan for three possible price movements: advance, decline or sideways. Have a plan for all three scenarios BEFORE making the trade. Consider possible holding times. And finally, look at overall market conditions and sector/industry performance.


