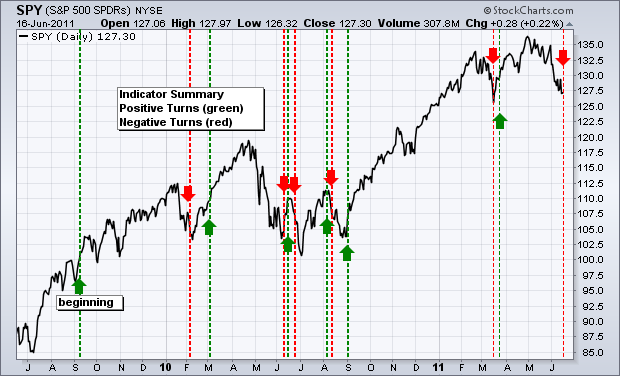
Believe it or not, there was only one downgrade to the indicator summary this week. The AD Volume Lines for the Nasdaq and NYSE broke below their March lows. Admittedly, these indicators barely broke their March lows with Wednesday's sharp decline. This could be an overshoot based on some panic selling. For now, a break is a break and I will cross the over-shoot bridge later. Namely, a multi-day surge on big breadth would call for a reassessment. With the current downgrade, the indicator summary turned negative for the first time since March 25th. Of note, the major index ETFs have yet to break their March lows and remain way oversold. This means we could see a bounce in the coming weeks.
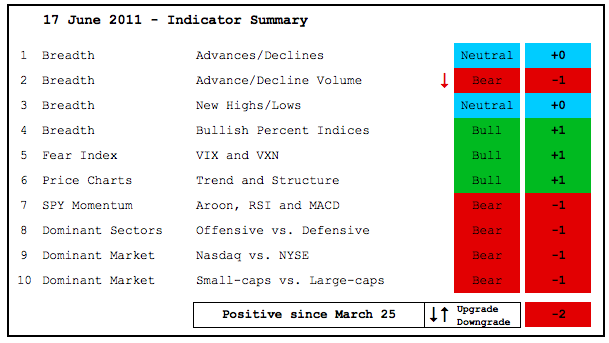
- AD Lines: Neutral. The Nasdaq AD Line failed to confirm the April high in the Nasdaq and broke below its March low. The NYSE AD Line hit a new high on May 31st and remains in an uptrend overall.
- AD Volume Lines: Bearish. The Nasdaq and NYSE AD Volume Lines formed big Double Tops and broke below their March lows to confirm.
- Net New Highs: Neutral. Nasdaq Net New Highs have been negative the entire month of June, but NYSE Net New Highs are still hovering around the zero line.
- Bullish Percent Indices: Bullish. Four of the nine sector Bullish Percent Indices are below 50% (energy, technology, industrials, materials). The rest are above 50%.
- VIX/VXN: Bullish. The CBOE Volatility Index ($VIX) and Nasdaq 100 Volatility Index ($VXN) finally moved with a surge above 22% this week. 25% remains my bearish line in the sand. A break above this level would show enough fear to warrant a bearish take on these indicators.
- Trend Structure: Bullish. The major index ETFs have been falling since early May 2011, but rising since June 2010 (12 months) and remain above their March lows.
- SPY Momentum: Bearish. MACD(5,35,5) is negative, Aroon(20) is below -50. RSI is below 50.
- Offensive Sector Performance: Bearish. The four offensive sectors (finance, consumer discretionary, technology, industrials) all broke their April lows and led the market lower this month.
- Nasdaq Performance: Bearish. The $COMPQ:$NYA ratio peaked in January and formed a lower high in May. The Nasdaq led the NY Composite lower since mid May.
- Small-cap Performance: Bearish. The $RUT:$OEX ratio formed a lower high in May and broke below its May low with a sharp decline in June. Small-caps are showing relative strength since early April.
- Breadth Charts (here) and Inter-market charts (here) have been updated.
This table is designed to offer an objective look at current market conditions. It does not aim to pick tops or bottoms. Instead, it seeks to identify noticeable shifts in buying and selling pressure. With 10 indicator groups, the medium-term evidence is unlikely to change drastically overnight.
Previous turns include:
Positive on 11-Sept-09
Negative on 5-Feb-10
Positive on 5-March-10
Negative on 11-Jun-10
Positive on 18-Jun-10
Negative on 24-Jun-10
Positive on 6-Aug-10
Negative on 13-Aug-10
Positive on 3-Sep-10
Negative on 18-Mar-11
Positive on 25-Mar-11
Negative on 17-Jun-11


