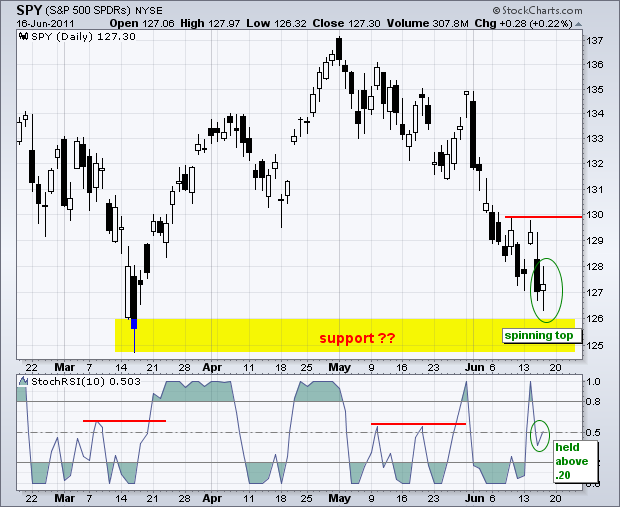
Stocks remain way oversold and ripe for a bounce in the coming days. On the daily charts, the S&P 500 ETF (SPY) and Russell 2000 ETF (IWM) formed spinning top candlesticks as both test support from the March lows. QQQ is also testing support here. Spinning tops signal indecision that can foreshadow a bounce, just like the spinning top four days ago. Obviously, this bounce did not hold. In the indicator window, StochRSI surged above .80 and pulled back below .50 the last few days. It is mildly positive that the indicator did not move all the way back below .20. Another surge above .80 would turn short-term momentum bullish.
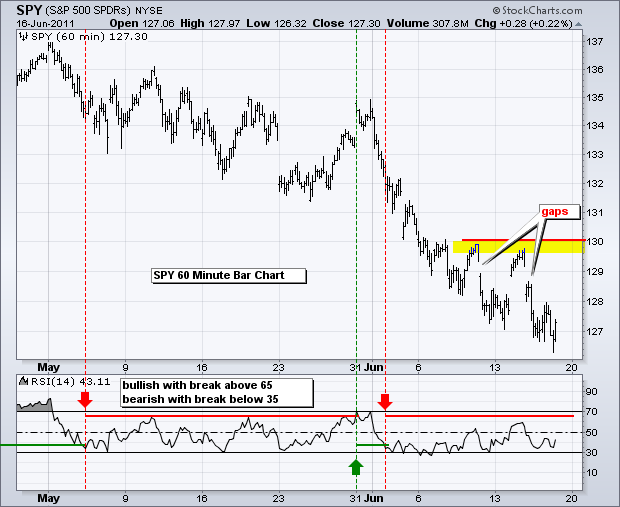
On the 60-minute chart, SPY has two gaps and resistance at 130 to contend with. A move above 130 would fill the gaps and break resistance. This would be enough to reverse the short-term downtrend. RSI remains in its bear zone (20-65). A move above 65 is needed to turn momentum bullish here.
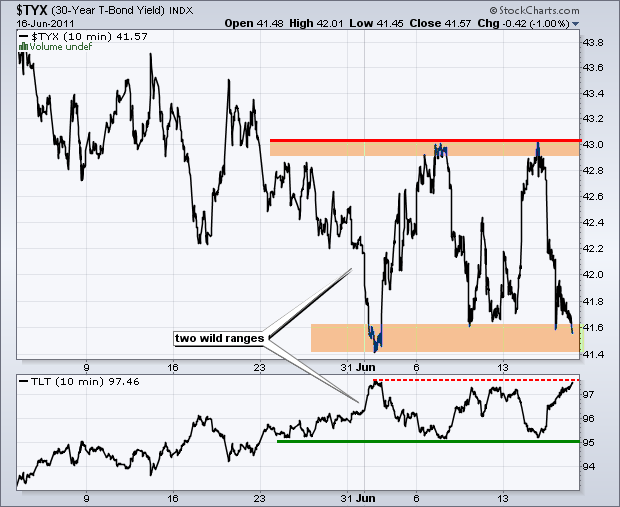
The bond market has been one big roller coaster the last three weeks. The 30-year Treasury Yield ($TYX) swung between 4.3% and 4.14% five times since May 23rd. Likewise, the 20+ year Bond ETF (TLT) swung from 95 to 97.5 during this timeframe. With TLT at resistance and stocks oversold, we could see another swing to the downside in the coming days.
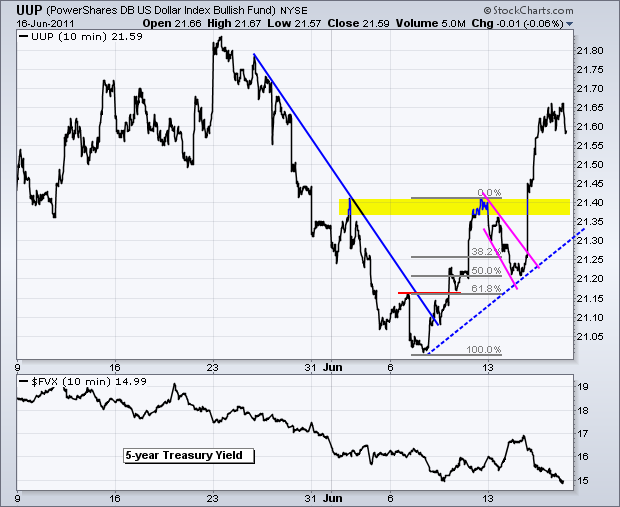
Turmoil in Greece has been bullish for bonds and the Dollar this week as money seeks a relative safe haven. The US Dollar Fund (UUP) broke flag/channel resistance and surged above 21.60 this week. The greenback is getting overbought and there is a Sarkozy/Merkel meeting in Berlin and European finance ministers are scheduled to meet on June 19th. We could see another kick-the-can-down-the-road accord announced Sunday evening that gives a lift to the Euro. Accord or no accord, the Greek situation depends on the outcome of a no-confidence for the Papandreou government. I am not sure when this will take place.
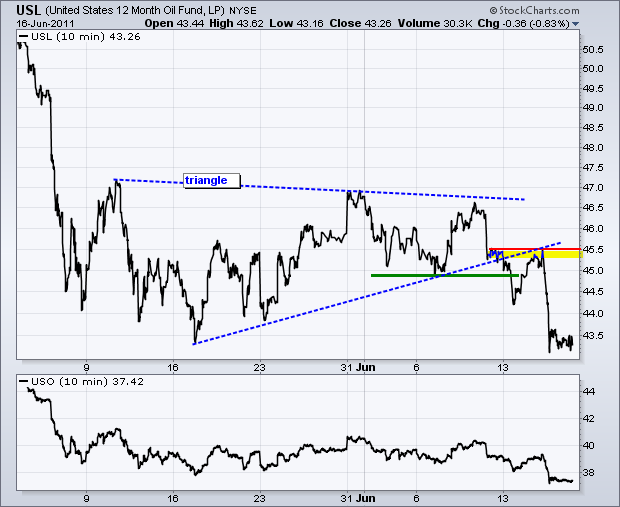
The 12-Month US Oil Fund (USL) is pretty much dependent on the Dollar and the stock market. A rebound in stocks and fall in the Dollar would give oil a boost. On the chart, USL remains in bear mode after a clear support break this week. Broken supports around 44.7-45.5 turn into the first resistance area to watch.
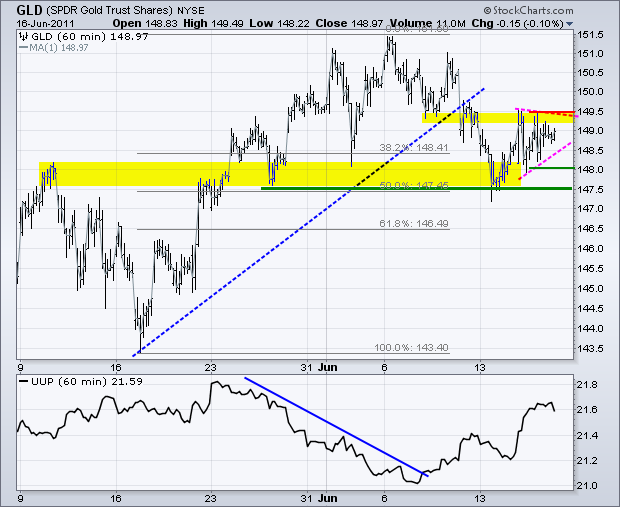
The Gold SPDR (GLD) broke support around 149.5 last week and rebounded off a bigger support level this week. Trading turned quite choppy the last few days as a triangle took shape. Short-term, traders can watch the triangle for the next directional break. A break above 149.5 would be bullish, while a break below 148 would be bearish. Gold stocks got hammered in June and relative weakness in the Gold Miners ETF (GDX) is not a good sign for bullion.
Key Economic Reports/Events:
Fri - Jun 17 - 09:55 - Michigan Sentiment
Fri - Jun 17 - 10:00 - Leading Indicators
Chart of Interest: Tuesday and Thursday in separate post.
This commentary and charts-of-interest are designed to stimulate thinking. This analysis is not a recommendation to buy, sell, hold or sell short any security (stock ETF or otherwise). We all need to think for ourselves when it comes to trading our own accounts. First, it is the only way to really learn. Second, we are the only ones responsible for our decisions. Think of these charts as food for further analysis. Before making a trade, it is important to have a plan. Plan the trade and trade the plan. Among other things, this includes setting a trigger level, a target area and a stop-loss level. It is also important to plan for three possible price movements: advance, decline or sideways. Have a plan for all three scenarios BEFORE making the trade. Consider possible holding times. And finally, look at overall market conditions and sector/industry performance.

The bond market has been one big roller coaster the last three weeks. The 30-year Treasury Yield ($TYX) swung between 4.3% and 4.14% five times since May 23rd. Likewise, the 20+ year Bond ETF (TLT) swung from 95 to 97.5 during this timeframe. With TLT at resistance and stocks oversold, we could see another swing to the downside in the coming days.

Turmoil in Greece has been bullish for bonds and the Dollar this week as money seeks a relative safe haven. The US Dollar Fund (UUP) broke flag/channel resistance and surged above 21.60 this week. The greenback is getting overbought and there is a Sarkozy/Merkel meeting in Berlin and European finance ministers are scheduled to meet on June 19th. We could see another kick-the-can-down-the-road accord announced Sunday evening that gives a lift to the Euro. Accord or no accord, the Greek situation depends on the outcome of a no-confidence for the Papandreou government. I am not sure when this will take place.

The 12-Month US Oil Fund (USL) is pretty much dependent on the Dollar and the stock market. A rebound in stocks and fall in the Dollar would give oil a boost. On the chart, USL remains in bear mode after a clear support break this week. Broken supports around 44.7-45.5 turn into the first resistance area to watch.

The Gold SPDR (GLD) broke support around 149.5 last week and rebounded off a bigger support level this week. Trading turned quite choppy the last few days as a triangle took shape. Short-term, traders can watch the triangle for the next directional break. A break above 149.5 would be bullish, while a break below 148 would be bearish. Gold stocks got hammered in June and relative weakness in the Gold Miners ETF (GDX) is not a good sign for bullion.

Key Economic Reports/Events:
Fri - Jun 17 - 09:55 - Michigan Sentiment
Fri - Jun 17 - 10:00 - Leading Indicators
Chart of Interest: Tuesday and Thursday in separate post.
This commentary and charts-of-interest are designed to stimulate thinking. This analysis is not a recommendation to buy, sell, hold or sell short any security (stock ETF or otherwise). We all need to think for ourselves when it comes to trading our own accounts. First, it is the only way to really learn. Second, we are the only ones responsible for our decisions. Think of these charts as food for further analysis. Before making a trade, it is important to have a plan. Plan the trade and trade the plan. Among other things, this includes setting a trigger level, a target area and a stop-loss level. It is also important to plan for three possible price movements: advance, decline or sideways. Have a plan for all three scenarios BEFORE making the trade. Consider possible holding times. And finally, look at overall market conditions and sector/industry performance.

About the author:
Arthur Hill, CMT, is the Chief Technical Strategist at TrendInvestorPro.com. Focusing predominantly on US equities and ETFs, his systematic approach of identifying trend, finding signals within the trend, and setting key price levels has made him an esteemed market technician. Arthur has written articles for numerous financial publications including Barrons and Stocks & Commodities Magazine. In addition to his Chartered Market Technician (CMT) designation, he holds an MBA from the Cass Business School at City University in London.
Learn More
