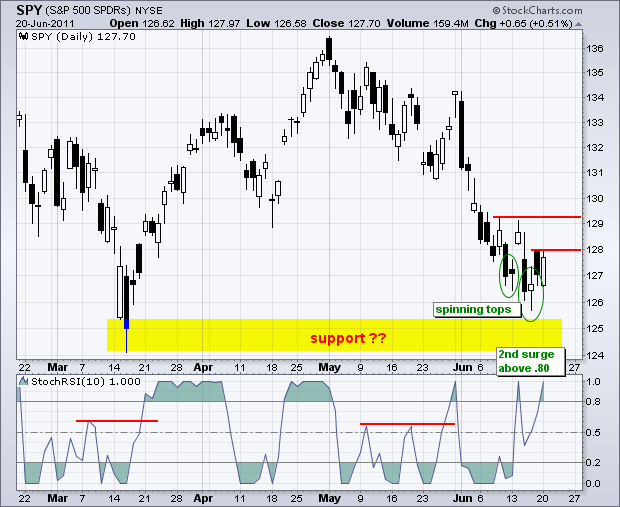
On the daily chart, the S&P 500 ETF (SPY) is making a stand at support from the March low. After two spinning tops last week, the ETF opened weak and closed pretty strong. Market breadth was not that strong though. Net Advances and Net Advancing Volume did not come close to the surge levels seen at the mid March and mid April lows. NYSE and Nasdaq volume levels were also very low, which can be expected just before the Greek government confidence vote on Tuesday and the FOMC policy statement on Wednesday. Truth be told, I am not that concerned with total exchange volume. Instead, I am more focused on Net Advancing Volume (volume of advancing stocks less volume of declining stocks). This indicator shows the real balance of power between buying and selling pressure. In contrast to total exchange volume, I think daily volume levels for individual stocks are important.
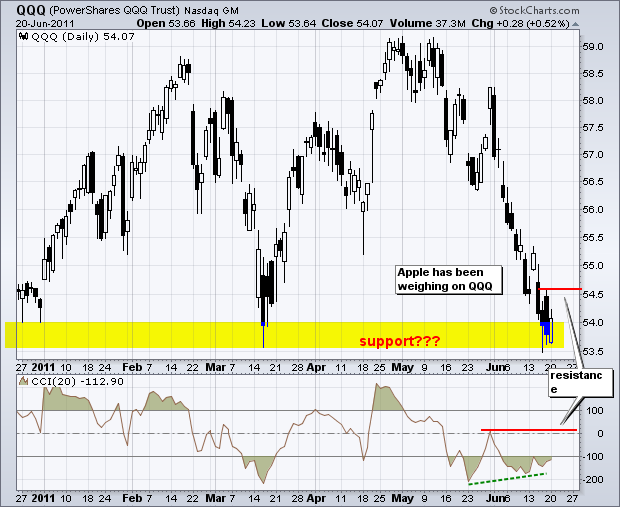
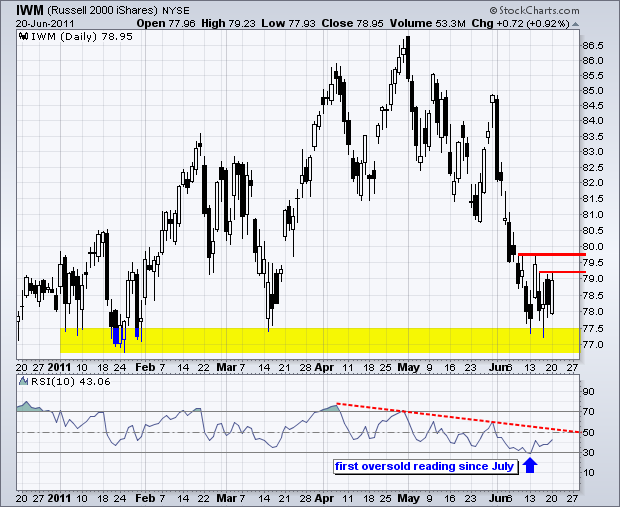
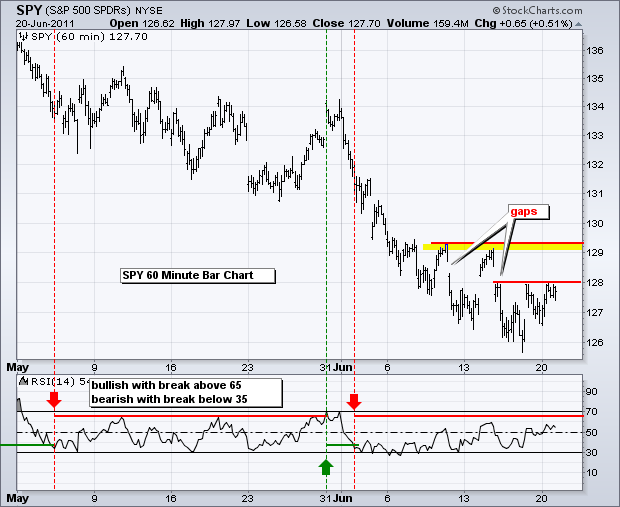
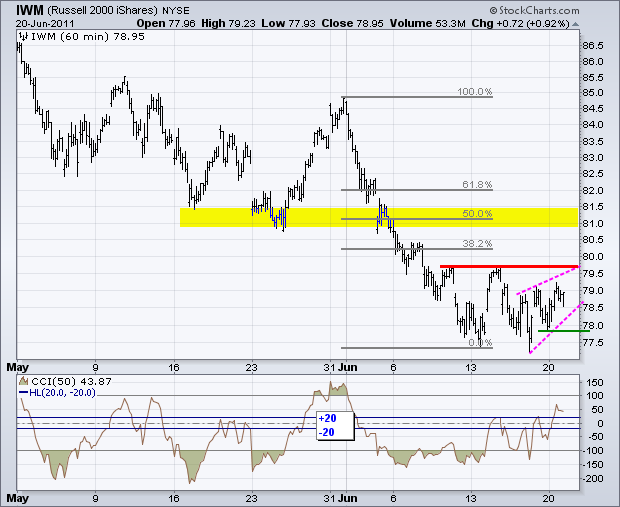
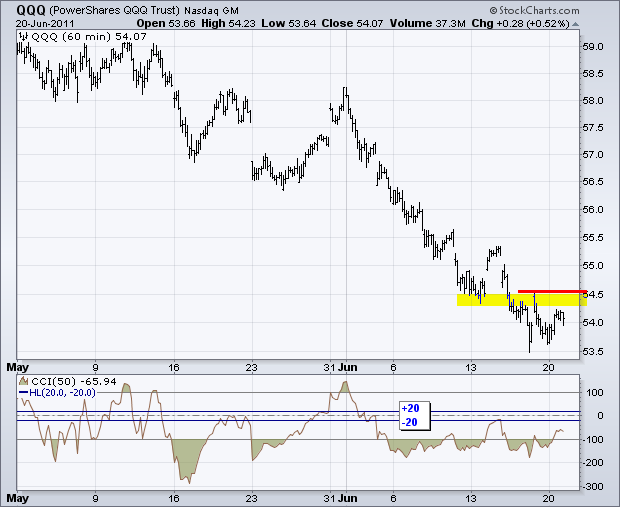
On the 60-minute charts, QQQ remains the weakest of the three, while IWM remains the strongest. SPY is somewhere in the middle. Notice that CCI on the IWM chart broke above +20. QQQ and SPY have yet to produce momentum breakouts. All three ETFs remain below resistance levels from the mid June highs. These are the levels that must be broken with strong breadth to suggest a sustainable trend reversal. Currently, all three ETFs remain in short-term downtrends and in what could be called the bottom picking stage. First support is based on Monday's low. Risk of whipsaw and volatility remains above average the next two days. FOMC announcement days are already volatile and the Greek situation just adds fuel to the fire.
Jun 21 10:00 Existing Home Sales
Jun 22 07:00 MBA Mortgage Index
Jun 22 10:30 Oil Inventories
Jun 22 12:30 FOMC Policy Statement
Jun 23 08:30 Jobless Claims
Jun 23 10:00 New Home Sales
Jun 24 08:30 GDP
Jun 24 08:30 Durable Orders
Chart of Interest: Tuesday and Thursday in separate post.
This commentary and charts-of-interest are designed to stimulate thinking. This analysis is not a recommendation to buy, sell, hold or sell short any security (stock ETF or otherwise). We all need to think for ourselves when it comes to trading our own accounts. First, it is the only way to really learn. Second, we are the only ones responsible for our decisions. Think of these charts as food for further analysis. Before making a trade, it is important to have a plan. Plan the trade and trade the plan. Among other things, this includes setting a trigger level, a target area and a stop-loss level. It is also important to plan for three possible price movements: advance, decline or sideways. Have a plan for all three scenarios BEFORE making the trade. Consider possible holding times. And finally, look at overall market conditions and sector/industry performance.

