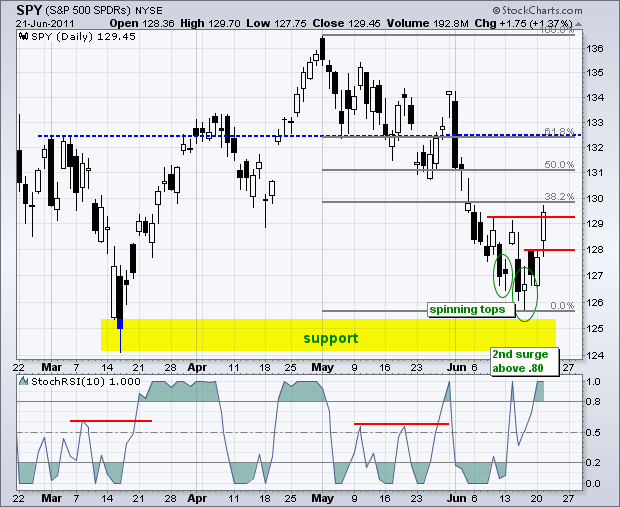
Techs and small-caps led the market higher as the S&P 500 ETF (SPY) broke above short-term resistance with a big surge. Breadth was also big with the Net Advances Ratios and Net Advancing Volume Ratios exceeding .50 ($NYAD:$NYTOT,$NYUD:$NYTV,$NAAD:$NATOT,$NAUD:$NATV). I will feature these charts in today's Market Message. This is the second such breadth surge in two weeks. On the price chart SPY blew through first resistance at 128 on the open and finished strong to close above second resistance at 129. This move solidifies support from the March-June lows. At this point, the breakout area around 128 becomes the first support level to watch for signs of a breakout failure. In the indicator window, StochRSI surged above .80 on Tuesday, which was the second time in two weeks. This put short-term momentum in bull mode a day before the breakout. StochRSI will remain bullish until it plunges below .20.
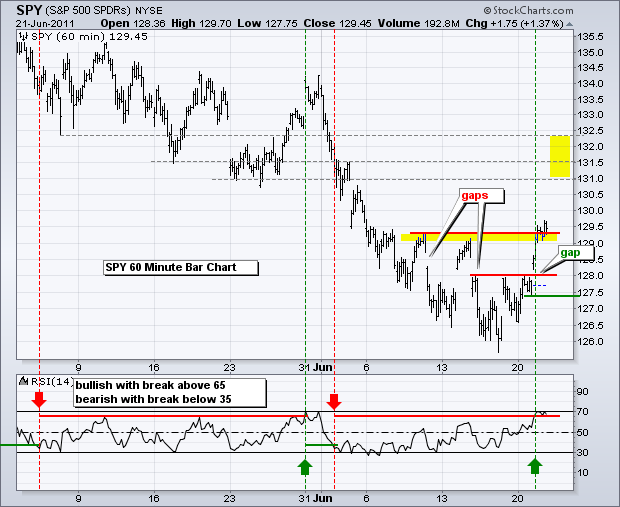
The 60-minute chart offers more granularity on the breakout. SPY filled the two down gaps with a gap and breakout at 128. RSI also broke resistance at 65 to turn short-term momentum bullish. With the breakout zone marking first support, I would set my first support line at 127.40. A move below this level would negate the breakout. As far as upside targets, the March highs and a 62% retracement of the May-June decline mark the highest target just above 132. There are also some broken support levels starting at 131 that mark potential resistance.
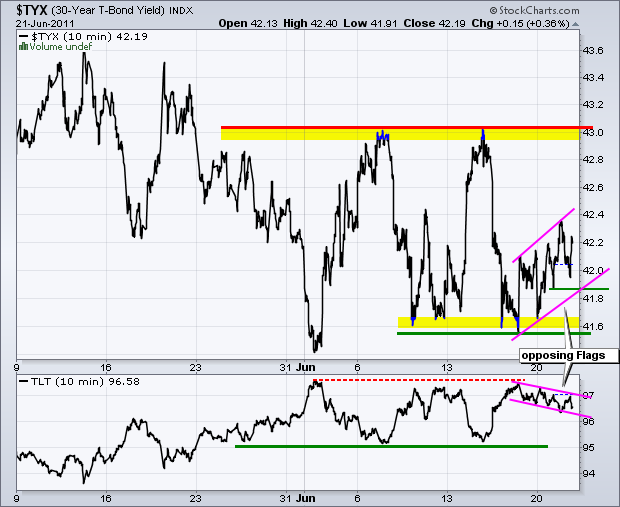
The 30-year Treasury Yield ($TYX) and the 20+ year Bond ETF (TLT) have opposing flags working the last few days. Yields are rising with a bear flag forming. Bonds are falling with a bull flag taking shape. Keep in mind that flags slope in the opposite direction of the prior move. A downside break in $TYX (±41.8) would reverse the rising flag and call for a move lower. Conversely, an upside break in TLT (97) would reverse the falling flag and call for a move higher. Traders should respect the short-term trend until a reversal is signaled.
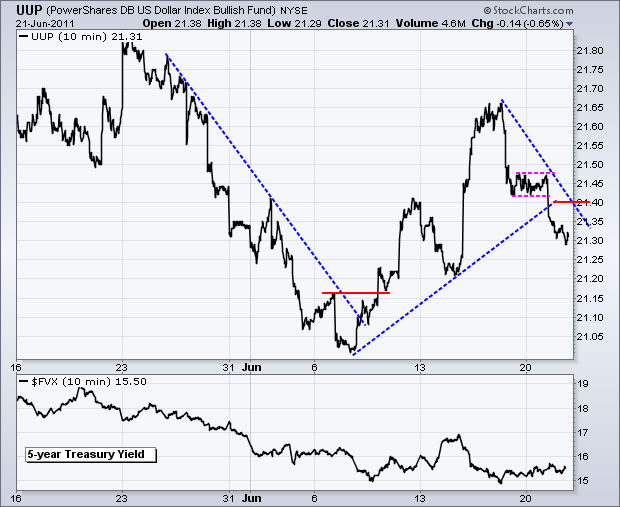
A little buy-the-rumor (Greek confidence vote) and sell-the-news is at work in the market. After surging above 21.65, the US Dollar Fund (UUP) declined below 21.30 just before the confidence vote. UUP is flat since the vote (overnight trading) as this rumor became reality. The short-term swing is down and I am marking first resistance at 21.40. The Dollar will take is next cue from the FOMC policy statement.
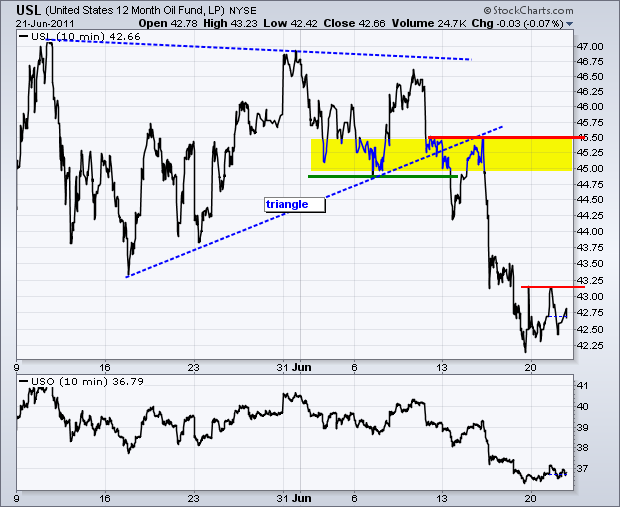
Despite a surge in stocks and decline in the Dollar this week, the 12-Month US Oil Fund (USL) barely budged. USL is currently stuck in an oversold trading range with resistance just above 43. Further strength in stocks and weakness in the Dollar would be positive for oil, but we need to see a breakout for signs of actual buying pressure that could lead to a rally.
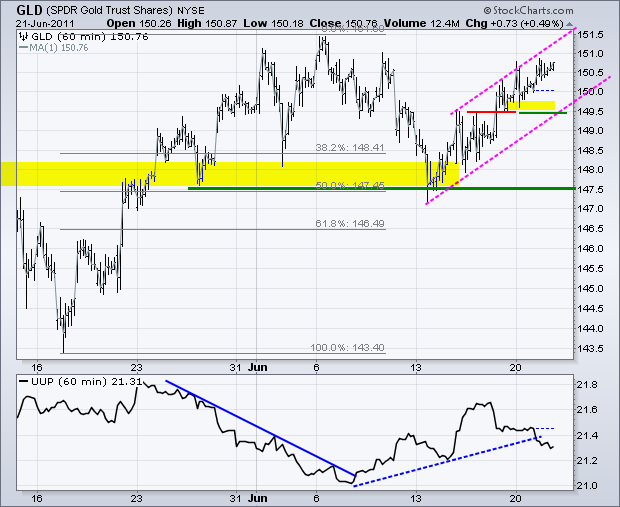
The Gold SPDR (GLD) continues to channel higher and is approaching the early June high. Even though this pattern looked like a rising wedge at first, the rise was never reversed with a support break. Broken resistance turns into first support at 149.50, a level confirmed by the lower trendline of the rising channel.
Key Economic Reports:
Jun 22 07:00 MBA Mortgage Index
Jun 22 10:30 Oil Inventories
Jun 22 12:30 FOMC Policy Statement
Jun 23 08:30 Jobless Claims
Jun 23 10:00 New Home Sales
Jun 24 08:30 GDP
Jun 24 08:30 Durable Orders
Chart of Interest: Tuesday and Thursday in separate post.
This commentary and charts-of-interest are designed to stimulate thinking. This analysis is not a recommendation to buy, sell, hold or sell short any security (stock ETF or otherwise). We all need to think for ourselves when it comes to trading our own accounts. First, it is the only way to really learn. Second, we are the only ones responsible for our decisions. Think of these charts as food for further analysis. Before making a trade, it is important to have a plan. Plan the trade and trade the plan. Among other things, this includes setting a trigger level, a target area and a stop-loss level. It is also important to plan for three possible price movements: advance, decline or sideways. Have a plan for all three scenarios BEFORE making the trade. Consider possible holding times. And finally, look at overall market conditions and sector/industry performance.


