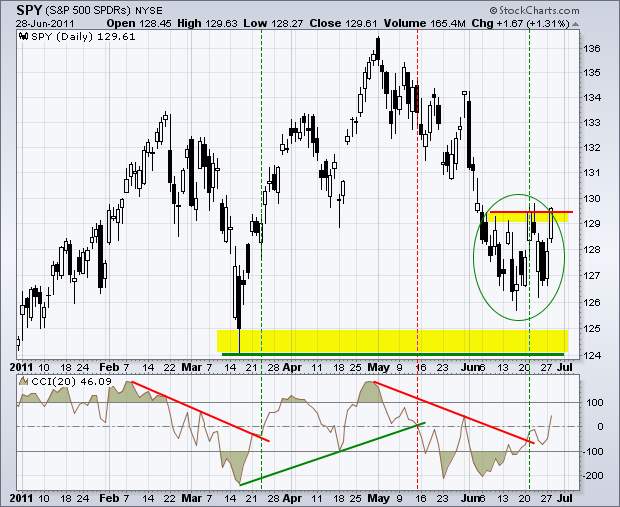
Small-caps and large-techs continue to lead the rebound off the March lows. The S&P 500 ETF (SPY) got into the action yesterday with a break above its mid June highs and the highest close since June 3rd. SPY is late to the breakout party, but better late than never I guess. At the very least, the volatile consolidation of the last few weeks affirms support in the 126 area, which is just above the March lows. In the indicator window, the Commodity Channel Index (CCI) broke above the red trendline last week and followed through with a move into positive territory this week. Momentum favors the bulls too.
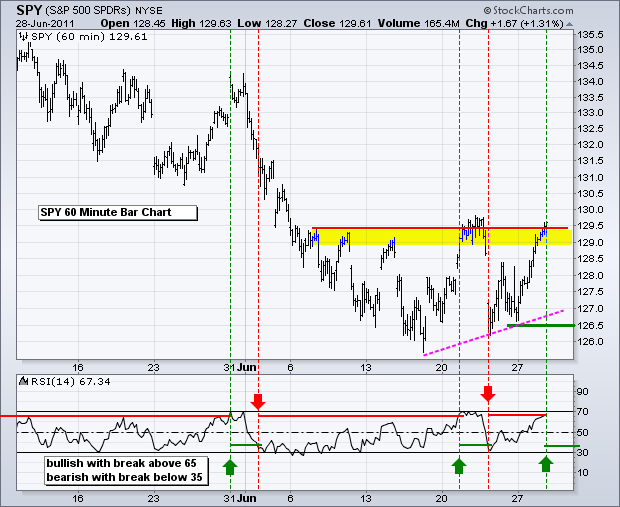
The 60-minute chart expands on the resistance zone around 129.5. This is at least the fourth attempt to break above 129.5 and hold above this level. RSI edged above 65 to turn momentum bullish. Recent moves above 65 were quickly turned back in early June and last week (red arrows). The early June surge was an oversold bounce within a downtrend and last week's bounce was part of a trading range. This is why RSI quickly failed and plunged below 35 both times. The early June plunge below 35 lasted a few weeks, but last week's plunge below 35 only lasted a few days. This is potentially positive because downside momentum was quickly reversed. I use the 65 and 35 as the bullish and bearish thresholds. Surges above 65 are deemed strong enough to consider a bigger trend change. No indicator or system is perfect. There will be whipsaws and bad signals. The key is to combine other aspects of technical analysis along with RSI or your momentum indicators.
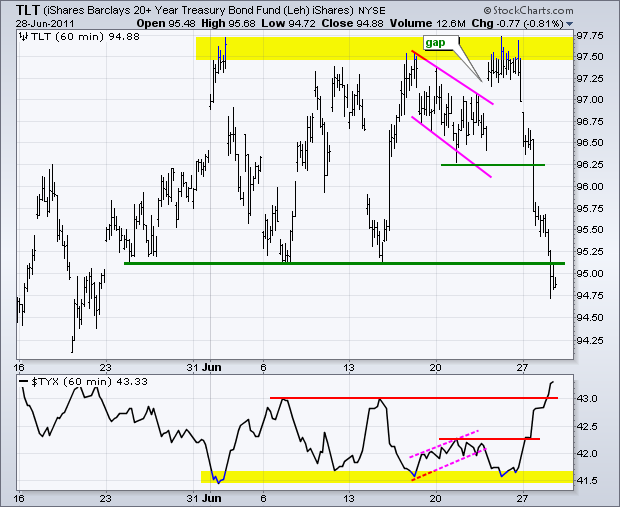
The rise in stocks and the Euro took its toll on bonds. The 20+ year Bond ETF (TLT) failed to hold the gap breakout around 97 and broke first support at 96.25 on Tuesday. Weakness continued on Wednesday as TLT broke below its June lows. This breakdown in bonds is positive for stocks because it favors the risk-on trade, which benefits stocks, the Euro and oil. Short-term, TLT is quite oversold after a move from 97.75 to 94.75 in just a few days.
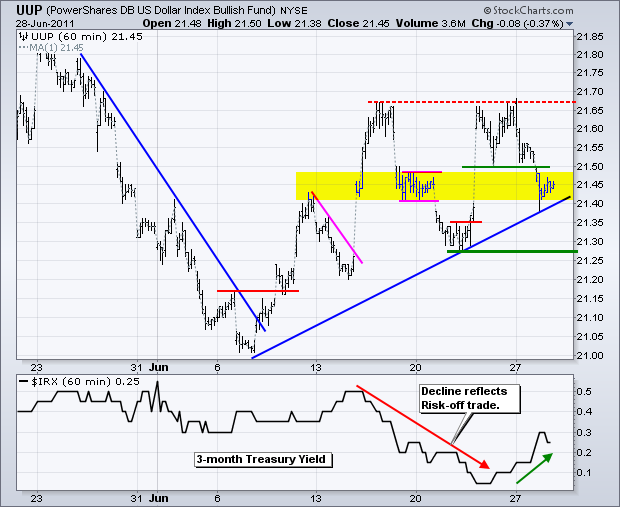
The US Dollar Fund (UUP) declined back to the trendline extending up from the June low. There is also support in this area from the 20-June consolidation and 13-June high (resistance turned support). Holding support or not depends on the Euro, which accounts for over 50% of the Dollar Index. Greek passage of the austerity package would likely produce another pop in the Euro and drop in the Dollar. We might see some Euro selling after the news as been digested.
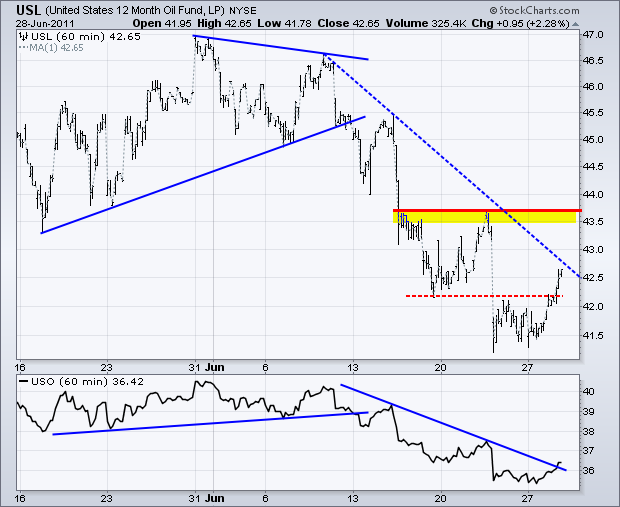
Like the S&P 500 ETF, the 12-Month US Oil Fund (USL) has been a little late to the risk-on party. We can blame this on the release of strategic stockpiles. US got an oversold bounce and mini-breakout with the surge above 42.5 on Wednesday. There is a bigger resistance zone just ahead though.
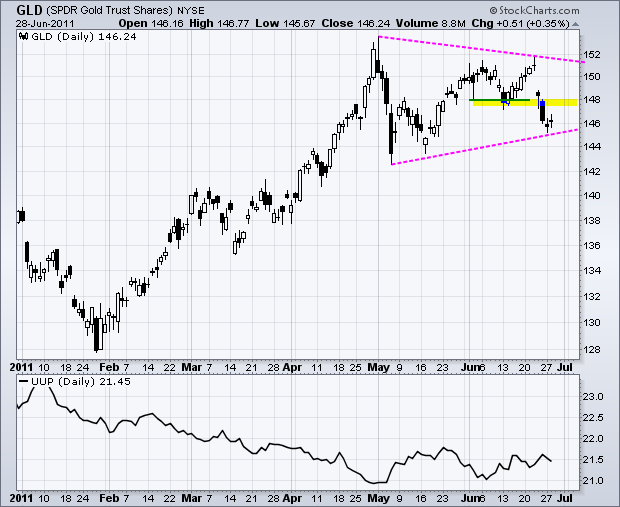
The Gold SPDR (GLD) is in a short-term downtrend, but a long-term uptrend. In fact, the daily chart sports a potential Triangle pattern since May. This could be just one big consolidation after the February-April surge. Keep in mid that GLD moved from 128 to 152 in just three months. A consolidation after such an advance is quite normal. Short-term, GLD is oversold and ripe for at least a short-term bounce. Broken support turns into first resistance around 148.
Key Economic Reports:
Wed - Jun 29 - 07:00 - MBA Mortgage Index
Wed - Jun 29 - 10:00 - Pending Home Sales
Wed - Jun 29 - 10:30 - Oil Inventories
Thu - Jun 30 - 08:30 - Jobless Claims
Thu - Jun 30 - 09:45 - Chicago PMI
Fri - Jul 01 - 09:55 - Michigan Sentiment
Fri - Jul 01 - 10:00 - ISM Index
Fri - Jul 01 - 10:00 - Construction Spending
Fri - Jul 01 - 15:00 - Auto/Truck Sales
Chart of Interest: Tuesday and Thursday in separate post.
This commentary and charts-of-interest are designed to stimulate thinking. This analysis is not a recommendation to buy, sell, hold or sell short any security (stock ETF or otherwise). We all need to think for ourselves when it comes to trading our own accounts. First, it is the only way to really learn. Second, we are the only ones responsible for our decisions. Think of these charts as food for further analysis. Before making a trade, it is important to have a plan. Plan the trade and trade the plan. Among other things, this includes setting a trigger level, a target area and a stop-loss level. It is also important to plan for three possible price movements: advance, decline or sideways. Have a plan for all three scenarios BEFORE making the trade. Consider possible holding times. And finally, look at overall market conditions and sector/industry performance.

The rise in stocks and the Euro took its toll on bonds. The 20+ year Bond ETF (TLT) failed to hold the gap breakout around 97 and broke first support at 96.25 on Tuesday. Weakness continued on Wednesday as TLT broke below its June lows. This breakdown in bonds is positive for stocks because it favors the risk-on trade, which benefits stocks, the Euro and oil. Short-term, TLT is quite oversold after a move from 97.75 to 94.75 in just a few days.

The US Dollar Fund (UUP) declined back to the trendline extending up from the June low. There is also support in this area from the 20-June consolidation and 13-June high (resistance turned support). Holding support or not depends on the Euro, which accounts for over 50% of the Dollar Index. Greek passage of the austerity package would likely produce another pop in the Euro and drop in the Dollar. We might see some Euro selling after the news as been digested.

Like the S&P 500 ETF, the 12-Month US Oil Fund (USL) has been a little late to the risk-on party. We can blame this on the release of strategic stockpiles. US got an oversold bounce and mini-breakout with the surge above 42.5 on Wednesday. There is a bigger resistance zone just ahead though.

The Gold SPDR (GLD) is in a short-term downtrend, but a long-term uptrend. In fact, the daily chart sports a potential Triangle pattern since May. This could be just one big consolidation after the February-April surge. Keep in mid that GLD moved from 128 to 152 in just three months. A consolidation after such an advance is quite normal. Short-term, GLD is oversold and ripe for at least a short-term bounce. Broken support turns into first resistance around 148.

Key Economic Reports:
Wed - Jun 29 - 07:00 - MBA Mortgage Index
Wed - Jun 29 - 10:00 - Pending Home Sales
Wed - Jun 29 - 10:30 - Oil Inventories
Thu - Jun 30 - 08:30 - Jobless Claims
Thu - Jun 30 - 09:45 - Chicago PMI
Fri - Jul 01 - 09:55 - Michigan Sentiment
Fri - Jul 01 - 10:00 - ISM Index
Fri - Jul 01 - 10:00 - Construction Spending
Fri - Jul 01 - 15:00 - Auto/Truck Sales
Chart of Interest: Tuesday and Thursday in separate post.
This commentary and charts-of-interest are designed to stimulate thinking. This analysis is not a recommendation to buy, sell, hold or sell short any security (stock ETF or otherwise). We all need to think for ourselves when it comes to trading our own accounts. First, it is the only way to really learn. Second, we are the only ones responsible for our decisions. Think of these charts as food for further analysis. Before making a trade, it is important to have a plan. Plan the trade and trade the plan. Among other things, this includes setting a trigger level, a target area and a stop-loss level. It is also important to plan for three possible price movements: advance, decline or sideways. Have a plan for all three scenarios BEFORE making the trade. Consider possible holding times. And finally, look at overall market conditions and sector/industry performance.

About the author:
Arthur Hill, CMT, is the Chief Technical Strategist at TrendInvestorPro.com. Focusing predominantly on US equities and ETFs, his systematic approach of identifying trend, finding signals within the trend, and setting key price levels has made him an esteemed market technician. Arthur has written articles for numerous financial publications including Barrons and Stocks & Commodities Magazine. In addition to his Chartered Market Technician (CMT) designation, he holds an MBA from the Cass Business School at City University in London.
Learn More


