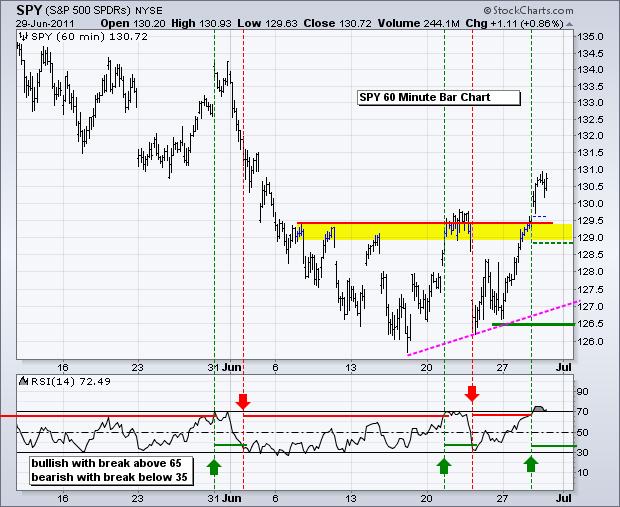
Stocks extended their gains on Wednesday with the S&P 500 ETF taking the lead. The day's gain was relatively modest (+.86%), but it was enough to comfortably clear resistance extending back to June 6th. I was impressed with Wednesday's price action in the Finance SPDR (XLF) as the ETF broke resistance and closed strong. This sector has been the main drag on SPY. The bulls could certainly use a little love from the finance sector.
Overall, small-caps remain the leaders over the last 10 days. IWM closed higher 8 of the last 10 days, SPY was up 7 of the last 10 and QQQ was up 6 of the last 10. At this point, stocks are getting short-term overbought, which could give way to a pullback in the coming days. However, the medium-term picture is looking quite positive with this strong surge off support from the March lows.

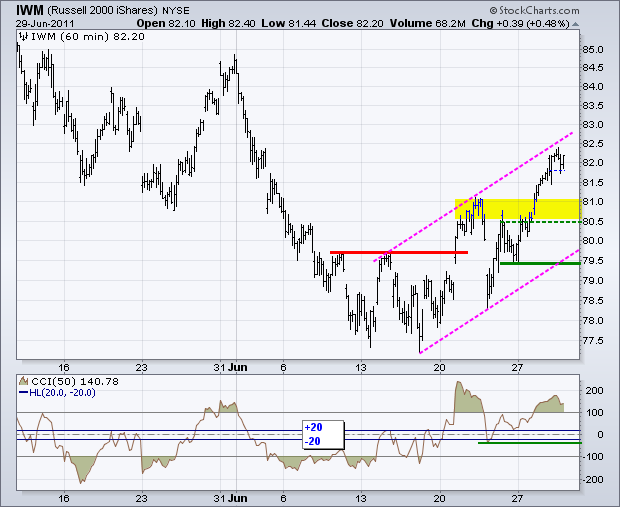
The Russell 2000 ETF (IWM) has been moving sharply higher ever since the big gap down last Thursday. The ETF immediately filled this gap and continued on to a new reaction high this week. It is possible that a rising flag has taken shape over the last three weeks, but the trend is clearly up as long as the flag riseth. Broken resistance turns into the first support zone around 80.5-81. The flag trendline and Friday's low mark key support at 79.40.

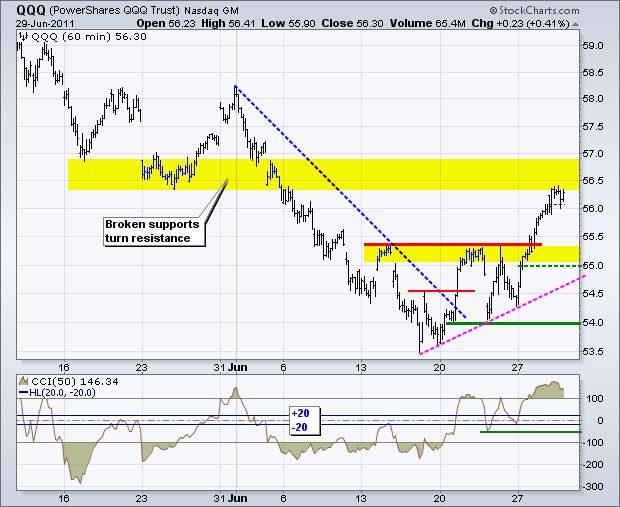
The Nasdaq 100 ETF (QQQ) broke out on Monday and continued above 56 the last two days. A small inverse Head-and-Shoulders formed with neckline resistance in the 55.35 area. Overall, I am going to set a support zone around 55-55.50. The trendline extending up from the June low should hit zone in a few days. This is the first area to watch on a pullback. Key support remains at 54, but will need to be raised as price action unfolds into next week.
Key Economic Reports:
Thu - Jun 30 - 08:30 - Jobless Claims
Thu - Jun 30 - 09:45 - Chicago PMI
Fri - Jul 01 - 09:55 - Michigan Sentiment
Fri - Jul 01 - 10:00 - ISM Index
Fri - Jul 01 - 10:00 - Construction Spending
Fri - Jul 01 - 15:00 - Auto/Truck Sales
Fri – Jul 01 – 08:00 – Arthur's Vacation
Chart of Interest: Tuesday and Thursday in separate post.
This commentary and charts-of-interest are designed to stimulate thinking. This analysis is not a recommendation to buy, sell, hold or sell short any security (stock ETF or otherwise). We all need to think for ourselves when it comes to trading our own accounts. First, it is the only way to really learn. Second, we are the only ones responsible for our decisions. Think of these charts as food for further analysis. Before making a trade, it is important to have a plan. Plan the trade and trade the plan. Among other things, this includes setting a trigger level, a target area and a stop-loss level. It is also important to plan for three possible price movements: advance, decline or sideways. Have a plan for all three scenarios BEFORE making the trade. Consider possible holding times. And finally, look at overall market conditions and sector/industry performance.


