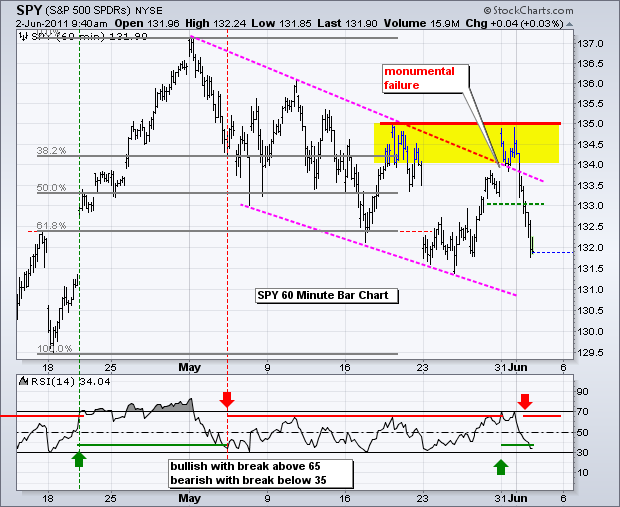
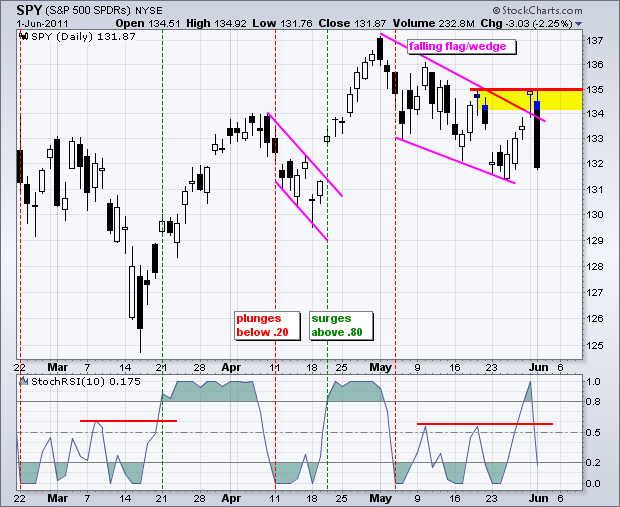
The S&P 500 ETF (SPY) surged above the wedge trendline with a four day advance and then gave it all back in one day. Wednesday's decline was broad-based with the most negative breadth since March. This decline signals the start of an extended decline or a washout that paves the way for a low. The long black candlestick on March 1st signaled the start of a decline, while the March 16th plunge signaled a selling climax. Wednesday's long black candlestick did not occur after an extended decline and therefore looks more like the beginning than the end. The key to any low, however, is a positive breadth surge and strong recovery. On the price chart, SPY failed at 135 resistance and confirmed the hanging man with a move back below the trendline. SPY also filled Tuesday's gap. This decline marks a massive failure that reinforces resistance at 135. A move above this level is needed to reverse the current downtrend.

Key Economic Reports/Events:
Thu - Jun 02 - 08:30 - Jobless Claims
Thu - Jun 02 - 10:00 - Factory Orders
Thu - Jun 02 - 11:00 - Oil Inventories
Fri - Jun 03 - 08:30 – Employment Report
Fri - Jun 03 - 10:00 - ISM Services Index
Charts of Interest: Tuesday and Thursday in separate post.
***********************************************
This commentary and charts-of-interest are designed to stimulate thinking. This analysis is not a recommendation to buy, sell, hold or sell short any security (stock ETF or otherwise). We all need to think for ourselves when it comes to trading our own accounts. First, it is the only way to really learn. Second, we are the only ones responsible for our decisions. Think of these charts as food for further analysis. Before making a trade, it is important to have a plan. Plan the trade and trade the plan. Among other things, this includes setting a trigger level, a target area and a stop-loss level. It is also important to plan for three possible price movements: advance, decline or sideways. Have a plan for all three scenarios BEFORE making the trade. Consider possible holding times. And finally, look at overall market conditions and sector/industry performance.


