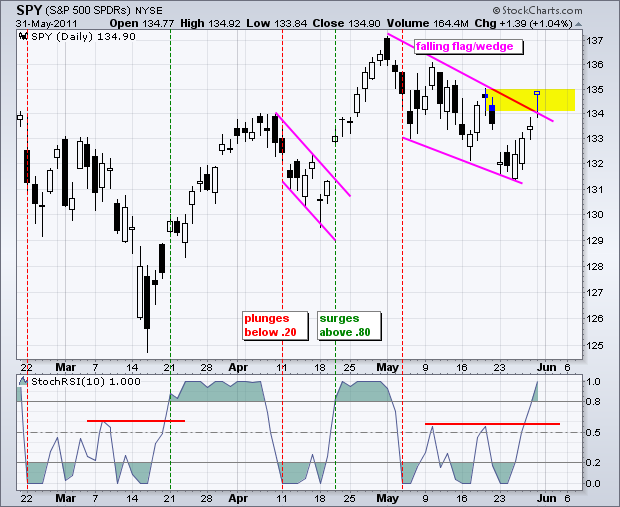
The S&P 500 ETF (SPY) made it four in a row with a surge and trendline breakout on Tuesday. SPY opened strong, dipped intraday and surged at the close. A hanging man candlestick formed with a small body and long lower shadow. These are potentially bearish candlestick reversal patterns, but they require confirmation with a break below their low. Also notice that this hanging man formed at the top of the resistance zone. At this point, I am not going to read too much into this hanging man. It means little as long as it remains unconfirmed. Don't forget that SPY close near its intraday high on Tuesday. The indicator window shows StochRSI moving above .80 for the first time since early May. The last surge above .80 lasted about a week and a half.

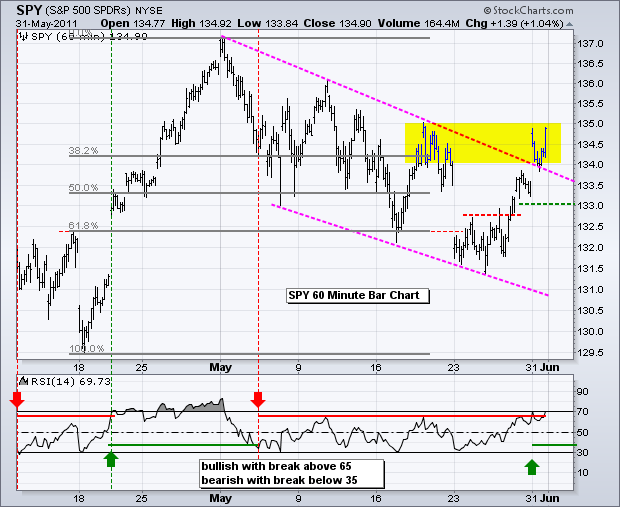
On the 60-minute chart, SPY gapped up and held the gap. This trendline break and gap become the first support levels to watch. This area also coincides with the hanging man low. I, however, am going to add a little buffer by setting first support at 133. A move below this level would clearly fill the gap and negate the trendline breakout.

RSI moved above 65 for the first time since early May. Notice how the trendline break coincided with the RSI break above 65. RSI breakouts tend to coincide with trendline breaks. At this point, momentum favors the bulls as long as RSI holds above 35.
Despite growing strength and successive bullish signals since the piercing pattern, the risk-reward ratio for new long positions is not very good at current levels. SPY is a little short-term overbought and the employment report looms large on Friday. Volatility could also increase as some key economic reports hit the market over the next three days.
Key Economic Reports/Events:
Wed - Jun 01 - 07:30 - Challenger Job Report
Wed - Jun 01 - 08:15 - ADP Employment Report
Wed - Jun 01 - 10:00 - ISM Manufacturing Index
Wed - Jun 01 - 10:00 - Construction Spending
Wed - Jun 01 - 15:00 – Auto/Truck Sales
Thu - Jun 02 - 08:30 - Jobless Claims
Thu - Jun 02 - 10:00 - Factory Orders
Thu - Jun 02 - 11:00 - Oil Inventories
Fri - Jun 03 - 08:30 – Employment Report
Fri - Jun 03 - 10:00 - ISM Services Index
Charts of Interest: Tuesday and Thursday in separate post.
***********************************************
This commentary and charts-of-interest are designed to stimulate thinking. This analysis is not a recommendation to buy, sell, hold or sell short any security (stock ETF or otherwise). We all need to think for ourselves when it comes to trading our own accounts. First, it is the only way to really learn. Second, we are the only ones responsible for our decisions. Think of these charts as food for further analysis. Before making a trade, it is important to have a plan. Plan the trade and trade the plan. Among other things, this includes setting a trigger level, a target area and a stop-loss level. It is also important to plan for three possible price movements: advance, decline or sideways. Have a plan for all three scenarios BEFORE making the trade. Consider possible holding times. And finally, look at overall market conditions and sector/industry performance.


