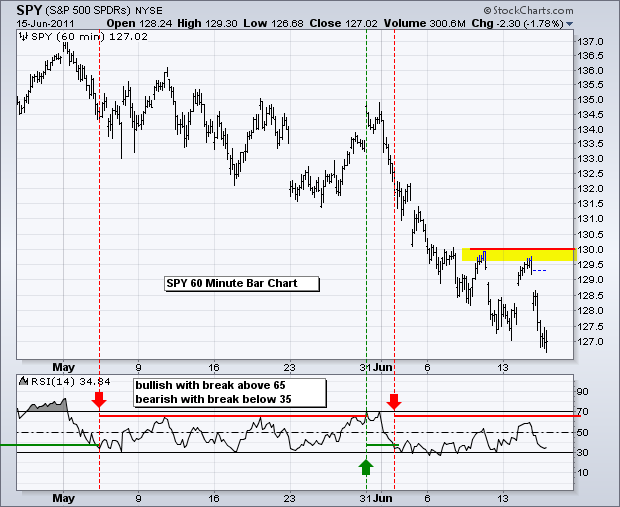
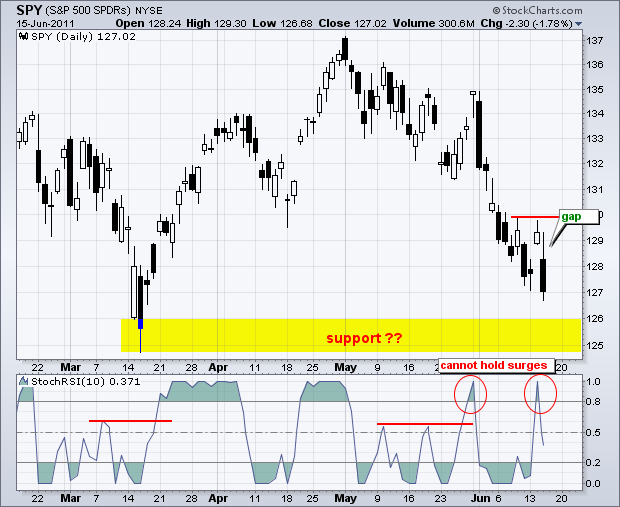
The S&P 500 ETF (SPY) attempted to reverse course twice, but both surges quickly failed at 130 and the ETF moved sharply lower. Tuesday's surge was followed by a gap down on Wednesday and close below Monday's low. Blame is on Bad news (on the door step). Economic reports have been below expectations, the Greek debt crisis remains unsolved and the finance sector continues to lead the way lower. There are two parts to the news. First, there is the news itself (bearish or bullish). Second, there is the market's reaction to the news (bearish or bullish). You can construct a 2x2 matrix to see the possible combinations. Right now we have bearish news and a bearish market reaction to the news. This is, unsurprisingly, bearish. It is bullish when the market firms or rises in the face of bearish news.
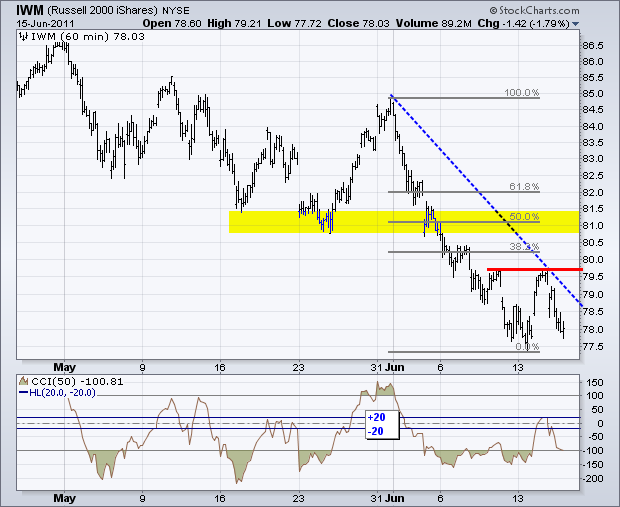
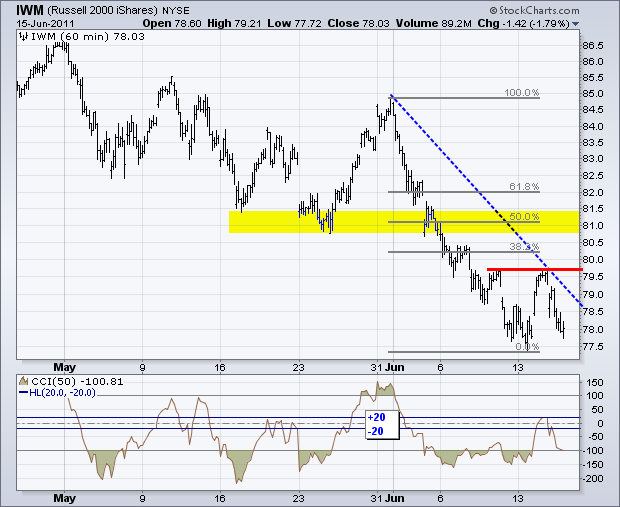
Turning back to the chart, all eyes are on the March lows. In fact, so many eyes are on the March lows that we will probably see a break below these lows and then an oversold bounce. The March lows could also mark the place for a selling climax in which a large hammer forms. The other alternative is a sharply lower open and then a strong close to form a piercing pattern or bullish engulfing. Bets on support are off until one of these patterns emerges. The 60-minute chart expands on resistance at 130. I am also enclosing the 60-minute charts for QQQ and IWM.


Key Economic Reports/Events:
Thu - Jun 16 - 08:30 - Jobless Claims
Thu - Jun 16 - 08:30 - Housing Starts/Building Permits
Thu - Jun 16 - 10:00 - Philadelphia Fed
Fri - Jun 17 - 09:55 - Michigan Sentiment
Fri - Jun 17 - 10:00 - Leading Indicators
Chart of Interest: Tuesday and Thursday in separate post.
This commentary and charts-of-interest are designed to stimulate thinking. This analysis is not a recommendation to buy, sell, hold or sell short any security (stock ETF or otherwise). We all need to think for ourselves when it comes to trading our own accounts. First, it is the only way to really learn. Second, we are the only ones responsible for our decisions. Think of these charts as food for further analysis. Before making a trade, it is important to have a plan. Plan the trade and trade the plan. Among other things, this includes setting a trigger level, a target area and a stop-loss level. It is also important to plan for three possible price movements: advance, decline or sideways. Have a plan for all three scenarios BEFORE making the trade. Consider possible holding times. And finally, look at overall market conditions and sector/industry performance.


