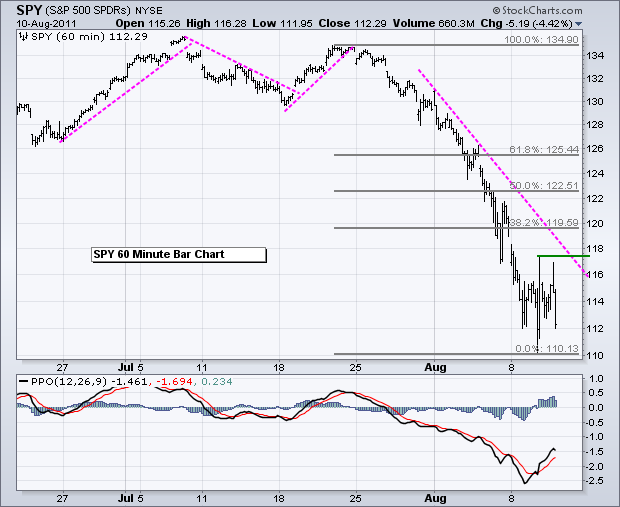
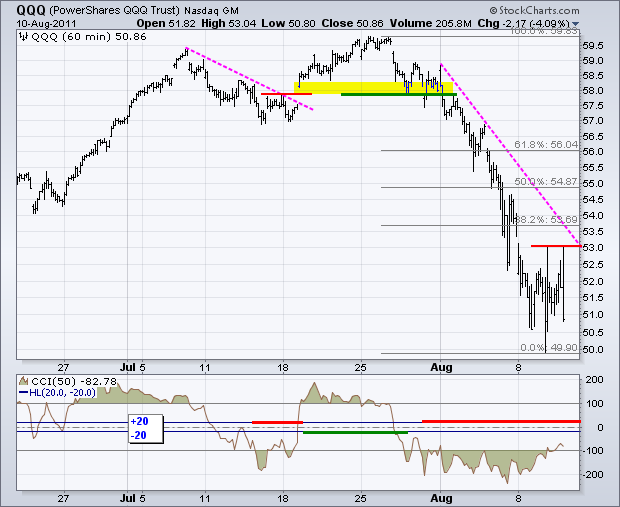
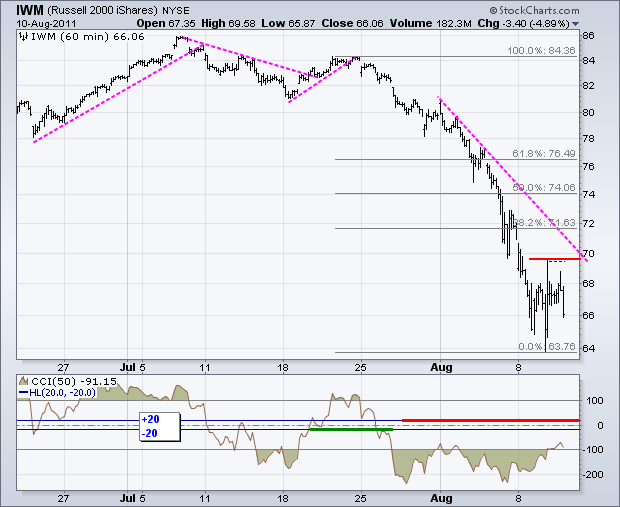
Stocks continued their wild ride with a decline that gave back Tuesday's gains. Even so, the major index ETFs remained above Tuesday's lows. In other words, Wednesday's decline is perhaps a test of the lows. Current volatility reminds me of May-July 2010, which was a volatile decline sparked by the flash crash of May 6th. Even though stocks bounced immediately after the May 6th flash-crash, more weakness followed and it took another seven weeks to finally hit bottom. Successful trading during this timeframe required buying near support and selling near resistance. Buying on the upside breakouts or selling on the support breaks resulted in whipsaws for a few weeks. We could be starting a similar phase now. Moreover, the major index ETFs are trading near support from this week's lows. Also note that the Russell 2000 ETF (IWM) and S&P MidCap 400 SPDR (MDY) held well above Tuesday's lows and show the most relative strength this week. The first chart shows SPY dipping back to support in the 110-112 area. Technically, a move above Tuesday's high would reverse the current downtrend. Similar resistance levels are shown on the IWM and QQQ charts.
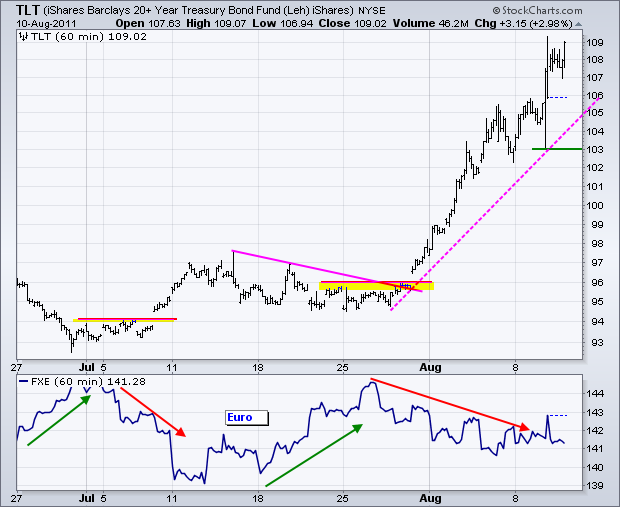
The 20+ year Bond ETF (TLT) surged as money moved back out of stocks. What a difference a day makes and Thursday is yet another day. TLT remains in a clear uptrend with another move above 109. Get this. TLT is up over 15% the last three weeks. Such unbridled strength in bonds points to economic weakness and this is negative for stocks. Key support is marked at 103.
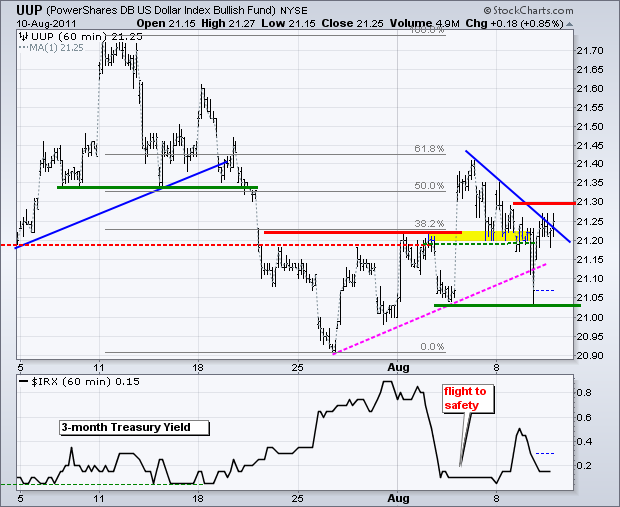
The US Dollar Fund (UUP) caught a bid on Wednesday and market attention turned to the Euro and potential problems with SocGen, Italy and Spain. Technically, UUP remains in an uptrend since the last week of July. Tuesday's sharp decline looked like a trend changing event, but the ETF ultimately held support. I am marking resistance at 21.30 and support at 21.03 as the key levels. This is a tough trade because the Euro and the Dollar are like hot potatoes that nobody wants to hold for too long.
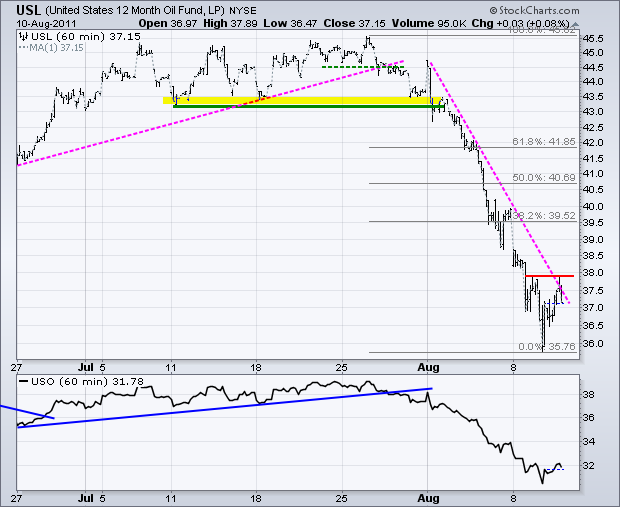
The 12-Month US Oil Fund (USL) held up better than the stock market on Wednesday. Actually, USL finished with a small gain in the face of sharp stock market losses. It is just one day, but it is a potential positive. Even though the trend is clearly down, it is clearly oversold and a retracement bounce could be in order. A move above 38 would break key resistance.
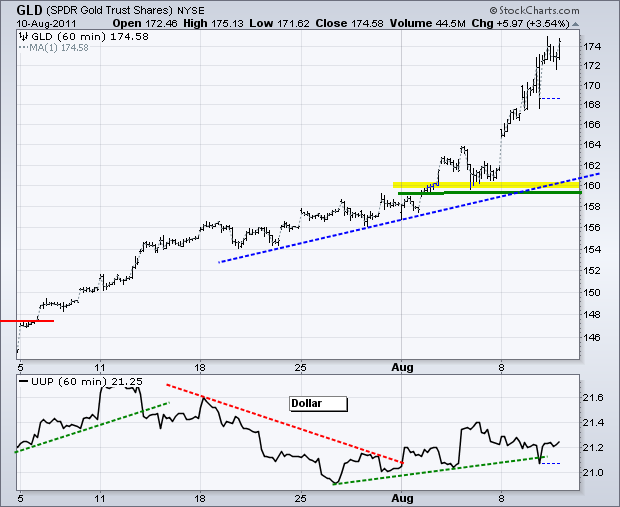
Gold just continues to shine. The Gold SPDR (GLD) closed above 174 with a strong in afternoon trading. Gold does not care where the crisis is, just as long as there is a crisis. Analysis is just as tricky at the stock market. The trends are clearly up, but the ETF is ripe for a pullback or consolidation.
Key Economic Reports:
Thu - Aug 11 - 08:30 - Jobless Claims
Fri - Aug 12 - 08:30 - Retail Sales
Fri - Aug 12 - 09:55 - Michigan Sentiment
Fri - Aug 12 - 10:00 - Business Inventories
Charts of Interest: On hold until volatility settles.
This commentary and charts-of-interest are designed to stimulate thinking. This analysis is not a recommendation to buy, sell, hold or sell short any security (stock ETF or otherwise). We all need to think for ourselves when it comes to trading our own accounts. First, it is the only way to really learn. Second, we are the only ones responsible for our decisions. Think of these charts as food for further analysis. Before making a trade, it is important to have a plan. Plan the trade and trade the plan. Among other things, this includes setting a trigger level, a target area and a stop-loss level. It is also important to plan for three possible price movements: advance, decline or sideways. Have a plan for all three scenarios BEFORE making the trade. Consider possible holding times. And finally, look at overall market conditions and sector/industry performance.


