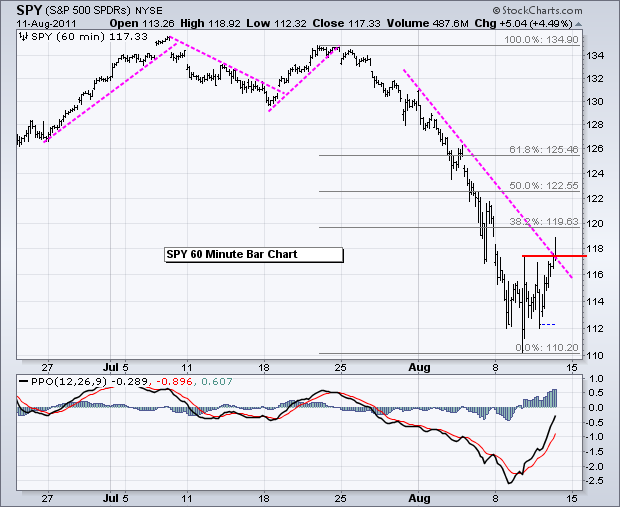
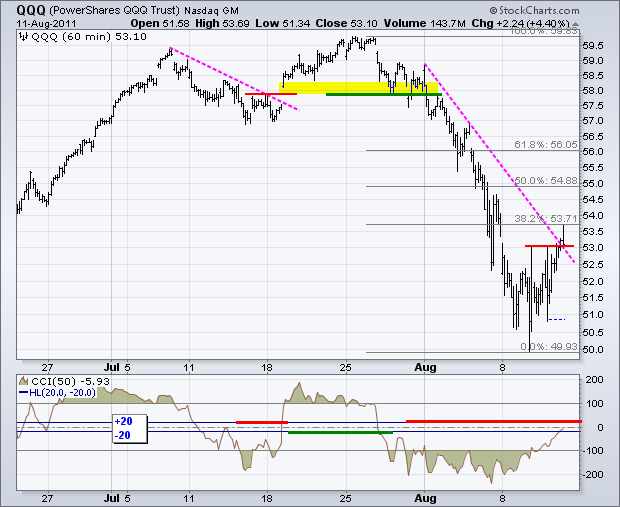
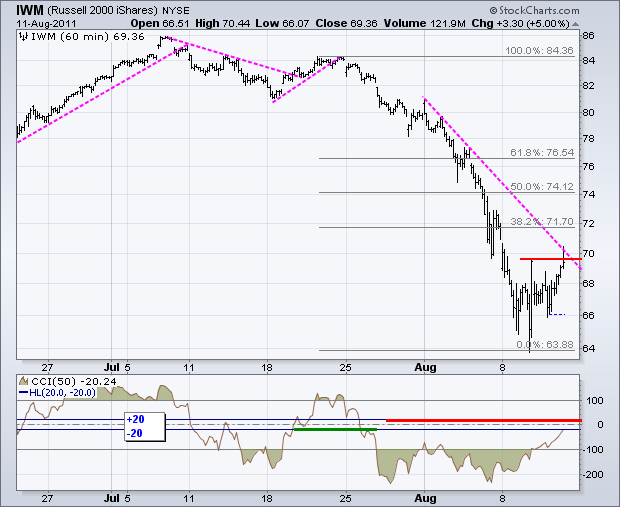
The stock market staged another big advance in the face of adversity. This is the second such advance in the last three days. All the same, the major index ETFs remain below their closing levels from last Friday. In other words, stocks are still down for the week. Small and midcaps led the rally with the Russell 2000 ETF (IWM) and S&P MidCap 400 SPDR (MDY) gaining 5% and 5.28%, respectively. It is positive to see the little guys leading the rebound. Stocks were also helped by a big decline in the bond market. Money clearly moved from bonds, which yield next-to-nothing, to stocks, which are selling at a discount from five weeks ago. At this point, it looks like a short-term uptrend is taking shape. However, the major index ETFs are already up substantially from Tuesday's low. As noted yesterday, turning bullish on breakouts and bearish on breakdowns is a recipe for whipsaw in volatile times and in sharp bear market rallies. Having said that, the SPY broke above resistance from Tuesday's high and the August trendline. While this breakout is enough to reverse the short-term downtrend, some key retracement levels are soon coming into play. The 38.2% retracement is at 120, the 50% retracement is at 119.63 and the 61.8% retracement is at 125.46. Picking which retracement will ultimately mark resistance is a guessing game, but I think the odds favor resistance in the 120-122 area and possibly a test of the early August lows.
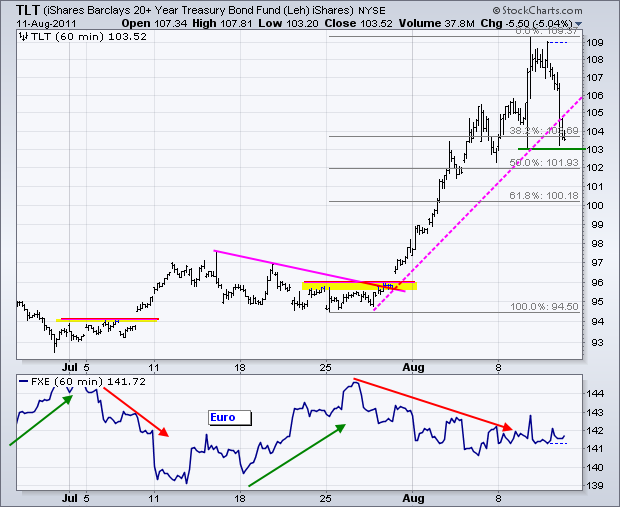
The 20+ year Bond ETF (TLT) took a big hit on Thursday with a decline back to support around 103. The ETF was down about as much as IWM and MDY were up. Bonds were also overbought after a big advance. There is a support zone around 103 marked by this week's low. I would not, however, be surprised to see a deeper correction to one of the other retracements around 100 or 102.
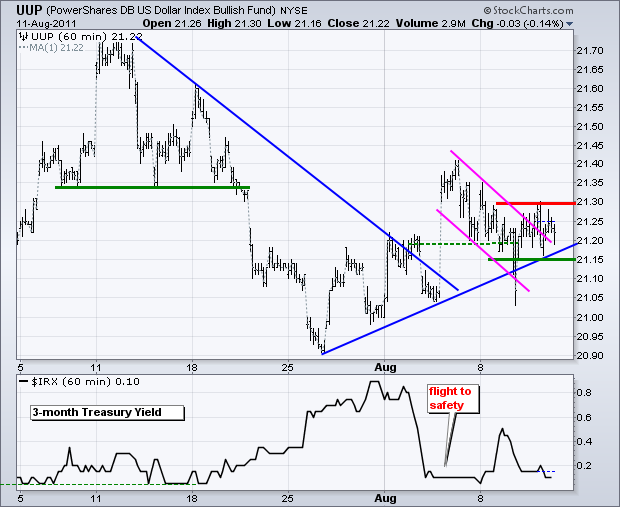
The US Dollar Fund (UUP) is stuck between a rock and a hard place. Admittedly, the ETF could easily go either way at this point. I am raising key support to 21.15 and key resistance remains at 21.30. A slight uptrend is present with the rise since late July. A break above this week's high would argue for another leg higher, which would be negative for stocks. It all depends on the Euro, which accounts for around 57% of the US Dollar Index.
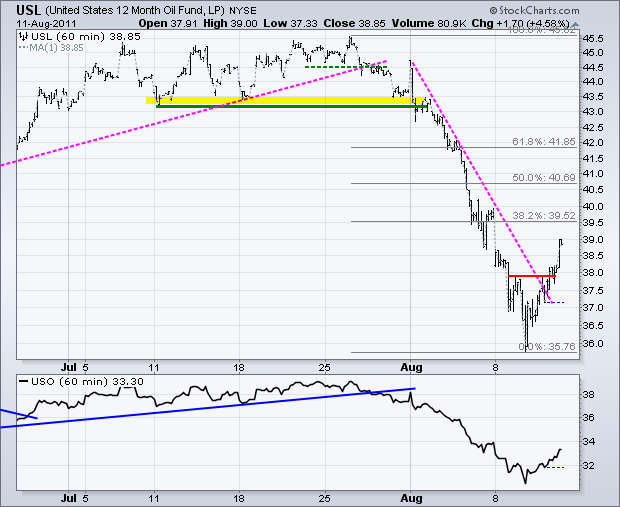
The 12-Month US Oil Fund (USL) followed the stock market higher with a 4+ percent surge on Thursday. The chart is just like the major index ETFs. USL is now in a short-term uptrend with the Fibonacci retracements marking potential resistance or reversal levels. Oil's fate hinges on stocks.
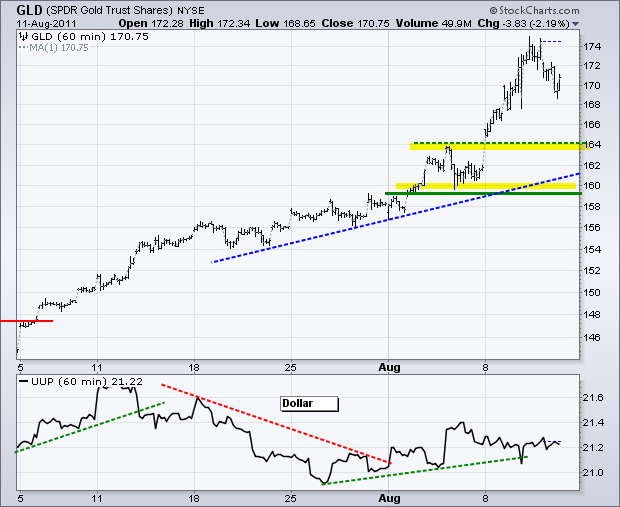
Firmness in the Dollar and strength in stocks favored the risk-on trade Thursday. As such, bonds and gold moved sharply lower. The Gold SPDR (GLD) remains in an uptrend overall, but became very oversold after the surge to 174. Broken resistance and the gap zone mark support around 164. Key support remains in the 159-160 area.
Key Economic Reports:
Fri - Aug 12 - 08:30 - Retail Sales
Fri - Aug 12 - 09:55 - Michigan Sentiment
Fri - Aug 12 - 10:00 - Business Inventories
Charts of Interest: Tuesday and Thursday in separate post.
This commentary and charts-of-interest are designed to stimulate thinking. This analysis is not a recommendation to buy, sell, hold or sell short any security (stock ETF or otherwise). We all need to think for ourselves when it comes to trading our own accounts. First, it is the only way to really learn. Second, we are the only ones responsible for our decisions. Think of these charts as food for further analysis. Before making a trade, it is important to have a plan. Plan the trade and trade the plan. Among other things, this includes setting a trigger level, a target area and a stop-loss level. It is also important to plan for three possible price movements: advance, decline or sideways. Have a plan for all three scenarios BEFORE making the trade. Consider possible holding times. And finally, look at overall market conditions and sector/industry performance.


