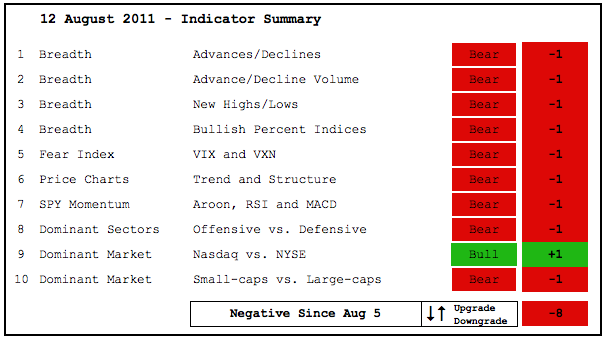
The indicator summary remains unchanged after a topsy-turvy week. Nine of the ten indicators are clearly in bear mode. The Nasdaq/NY Composite ratio is the only indicator considered positive because the Nasdaq is outperforming the NY Composite. Relative strength in techs is heavily outweighed by the bearish indications. Most importantly, all three breadth groups are bearish. The AD Lines and AD Volume Lines are in downtrends. The Cumulative Net New Highs Lines turned down as well. Even though stocks are getting an oversold bounce, I do consider this an oversold bounce within a bigger downtrend.

- AD Lines: Bearish. The Nasdaq AD Line hit a new 52-week low this week and the NYSE AD Line broke below its June low this month. Both are in downtrends.
- AD Volume Lines: Bearish. The AD Volume Lines broke below their March-June lows in late July and continued sharply lower in August. There is nothing but downtrend in these two breadth indicators.
- Net New Highs: Bearish. The Nasdaq and NYSE Net New Highs are in negative territory and the Cumulative Net New Highs Lines are trending down (Below their 10-day EMAs).
- Bullish Percent Indices: Bearish. Eight of the nine BPIs are below 50%. The utilities BPI is at 69.70% (highest), while the energy BPI is at an unbelievable 2.38% (lowest).
- VIX/VXN: Bearish. The CBOE Volatility Index ($VIX) and the Nasdaq 100 Volatility Index ($VXN) surged above 40%. Fear is at bearish levels as long as these two are above 25%.
- Trend Structure: Bearish. DIA, IWM, MDY, QQQ and SPY broke below their March-June lows to turn bearish. These broken resistance levels now turn into resistance.
- SPY Momentum: Bearish. RSI(14) moved below 30 to become oversold, but is in bear mode overall with resistance in the 50-60 area. MACD(5,35,5) was way oversold as well and turned up the last two days. The Aroon Oscillator remains in bear mode after a plunge below -50 and needs to move above +50 to turn bullish again.
- Offensive Sector Performance: Bearish. The Industrials SPDR (XLI), Consumer Discretionary SPDR (XLY), Technology ETF (XLK) and Finance SPDR (XLF) all broke support levels over the last few weeks.
- Nasdaq Performance: Bullish. The $COMPQ:$NYA ratio is about the only market related chart in an uptrend. The NY Composite is getting pounded as the Nasdaq holds up relatively well.
- Small-cap Performance: Bearish. The $RUT:$OEX ratio broke to new lows for 2011 and remains in a downtrend. Small-caps are underperforming and this is negative.
- Breadth Charts (here) and Inter-market charts (here) have been updated.
This table is designed to offer an objective look at current market conditions. It does not aim to pick tops or bottoms. Instead, it seeks to identify noticeable shifts in buying and selling pressure. With 10 indicator groups, the medium-term evidence is unlikely to change drastically overnight.

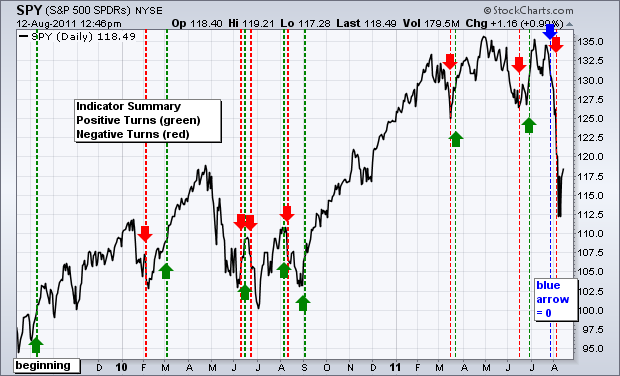
Previous turns include:
Positive on 11-Sept-09
Negative on 5-Feb-10
Positive on 5-March-10
Negative on 11-Jun-10
Positive on 18-Jun-10
Negative on 24-Jun-10
Positive on 6-Aug-10
Negative on 13-Aug-10
Positive on 3-Sep-10
Negative on 18-Mar-11
Positive on 25-Mar-11
Negative on 17-Jun-11
Positive on 30-Jun-11
Neutral on 29-Jul-11
Negative on 5-August-11


