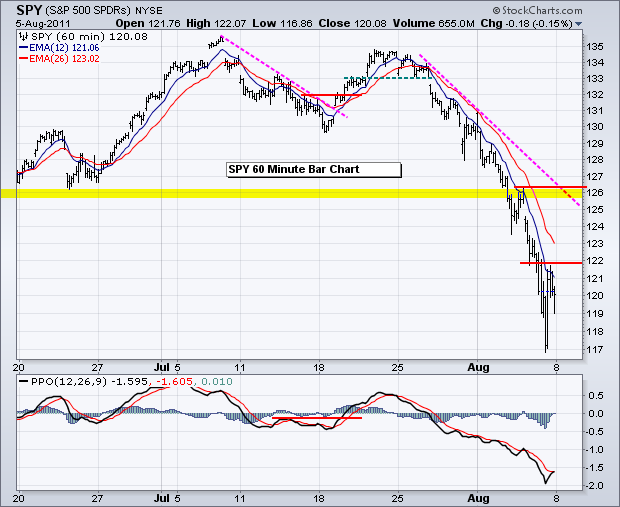
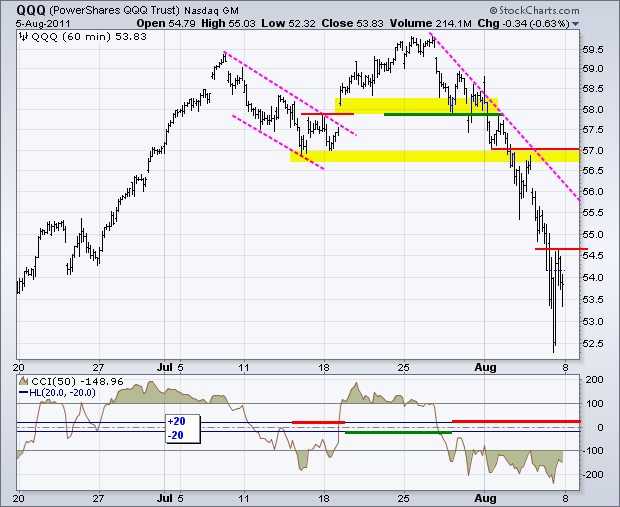
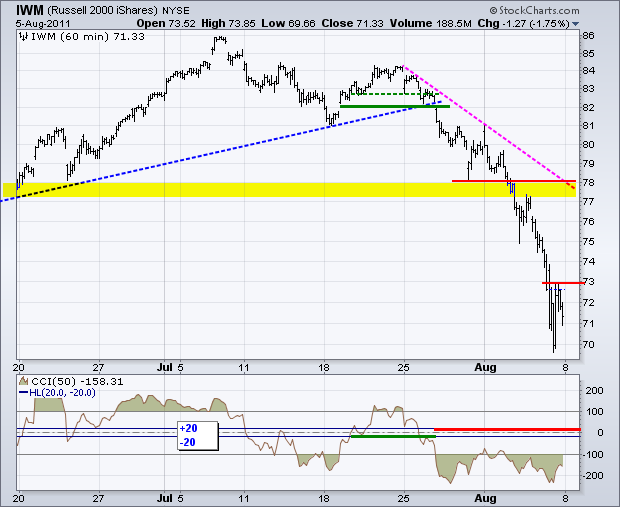
As of this writing, the markets are in panic after Standard and Poor's downgraded US debt late Friday. Stocks, bonds and oil are down sharply overnight. Dow futures were down around 274 points at 2AM ET. The Dollar is also down, but the losses are relatively modest. Gold is the only thing trading higher. Even though stocks closed well off their lows on Friday, the major index ETFs will most likely break these lows on Monday. Analysis remains a lesson in futility at this point. The stock market trend is the only thing certain right now and it is down. Further weakness on Monday will simply extend this trends, which is already oversold. For what it is worth, the Fed meets this week with a policy statement expected Tuesday afternoon.
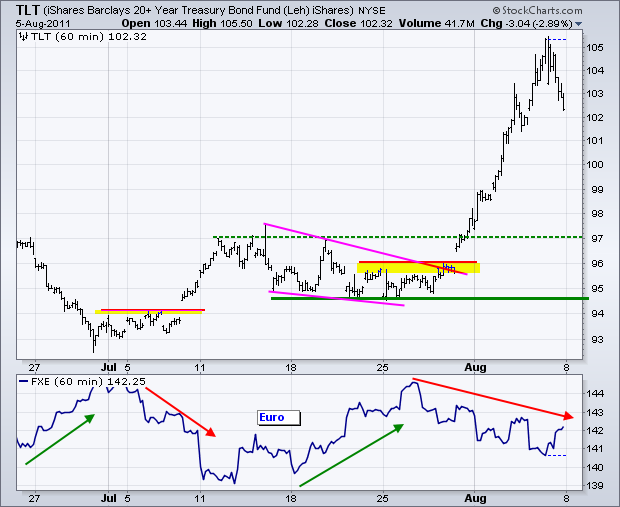
The 20+ year Bond ETF (TLT) is under selling pressure after the S&P downgrade. Bonds remain in short-term and medium-term uptrends, but TLT was ripe for a pullback after the 10+ percent surge the last two weeks. The S&P downgrade provides a great excuse to sell. Broken resistance turns into first support at 97. The late July lows mark key support in the 94.50 area.
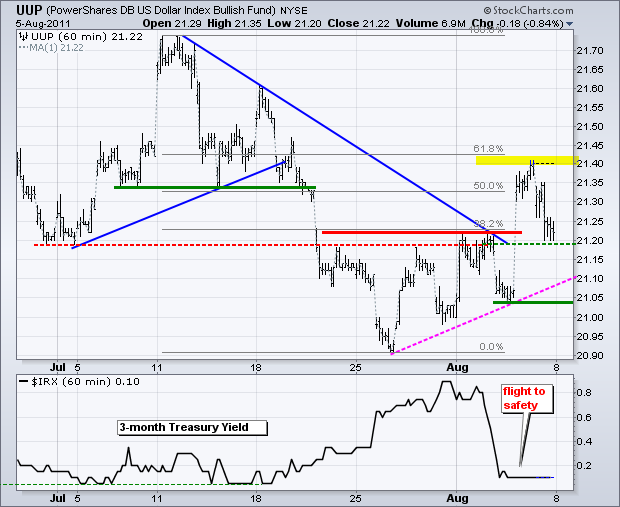
The US Dollar Fund (UUP) got its breakout last week, but met resistance near a key retracement and fell back. Deciphering this trend is one tough cookie. The ETF has been zigzagging higher the last two weeks, which means the short-term trend is still up. I am marking support at 21.03 and a break below this level would trigger a trend reversal.
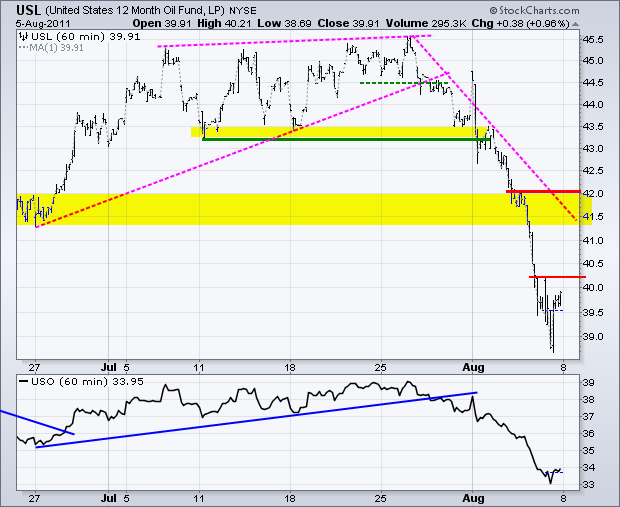
The 12-Month US Oil Fund (USL) is going the way of the stock market, which is down. Pervasive weakness in stocks and recent economic reports point to a slowing in economic growth, which means less demand for oil. USL was already oversold, but it is going to get even more oversold on Monday.
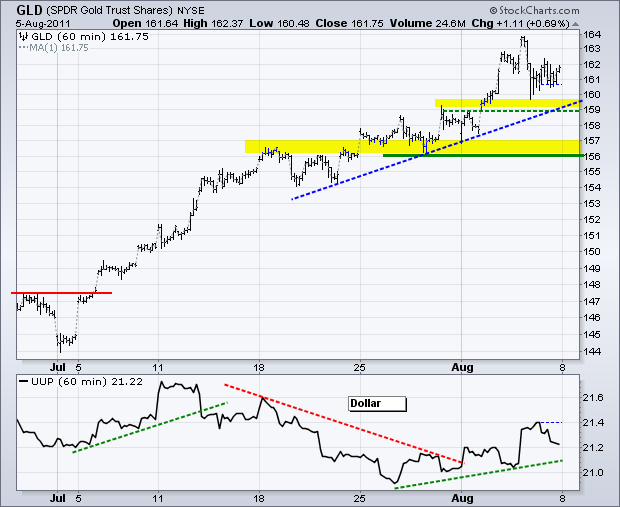
Outside the Swiss Franc and Japanese Yen, the gold remains the only valid alternative to Euros, Dollars, Euro debt and US debt. The Gold SPDR (GLD) broke resistance in early July and moved steadily higher the last five weeks. The uptrend may have slowed, but it was never in jeopardy of a reversal.
Key Economic Reports:
Tue - Aug 09 - 08:30 - Productivity/Labor Costs
Tue - Aug 09 - 14:15 - FOMC Policy Statement
Wed - Aug 10 - 07:00 - MBA Mortgage Index
Wed - Aug 10 - 10:30 - Oil Inventories
Thu - Aug 11 - 08:30 - Jobless Claims
Fri - Aug 12 - 08:30 - Retail Sales
Fri - Aug 12 - 09:55 - Michigan Sentiment
Fri - Aug 12 - 10:00 - Business Inventories
Charts of Interest: Tuesday and Thursday in separate post.
This commentary and charts-of-interest are designed to stimulate thinking. This analysis is not a recommendation to buy, sell, hold or sell short any security (stock ETF or otherwise). We all need to think for ourselves when it comes to trading our own accounts. First, it is the only way to really learn. Second, we are the only ones responsible for our decisions. Think of these charts as food for further analysis. Before making a trade, it is important to have a plan. Plan the trade and trade the plan. Among other things, this includes setting a trigger level, a target area and a stop-loss level. It is also important to plan for three possible price movements: advance, decline or sideways. Have a plan for all three scenarios BEFORE making the trade. Consider possible holding times. And finally, look at overall market conditions and sector/industry performance.


