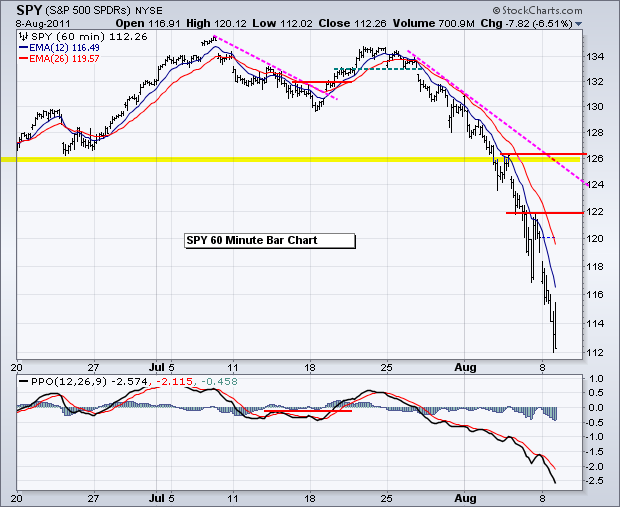
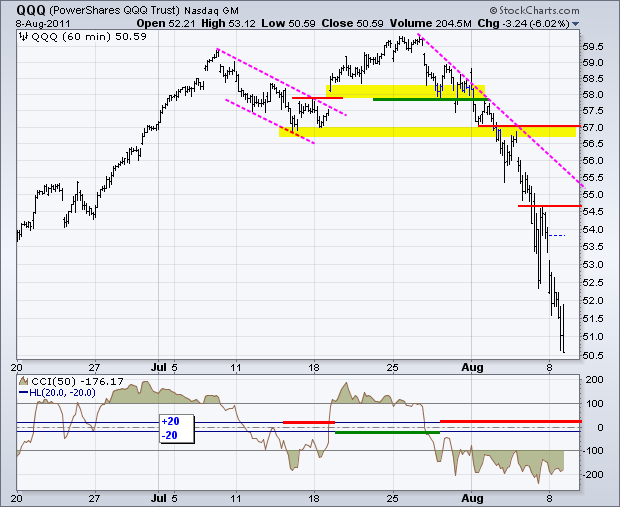
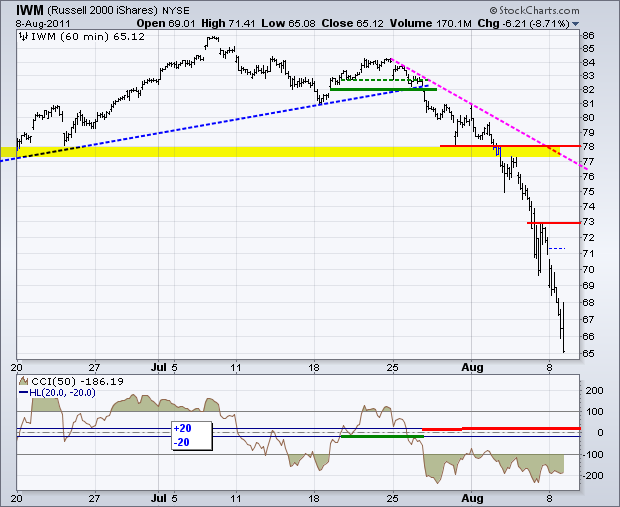
Stocks opened weak, remained weak and closed weak. The short-term and medium-term trends are clearly down at this point, but the current trends are way oversold after the sharp decline of the last two weeks. Going long at this point is a bottom picking exercise akin to catching a falling knife. Catch it by the handle and a trader would catch a decent oversold bounce. Catch it by the blade and it is going to hurt. Bottom picking in a mini-crash is not my forte. At this point, I am more prepared to wait for signs of support and buying pressure before considering a bounce. Even if stocks bounce, it is likely to be just an oversold bounce within a bigger downtrend. There are no charts of interest today. Stocks are too oversold, risk remains high and the Fed makes its policy statement today.
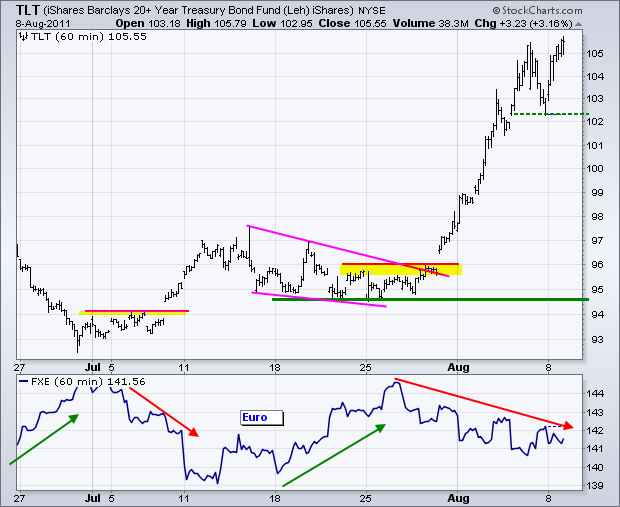
The 20+ year Bond ETF (TLT) surged to another new high with the move above 105 on Monday. With this move, a reaction low formed just above 102 and this marks first support. A lot depends on the stock market and the Euro. A bounce in both would lead to weakness in bonds.
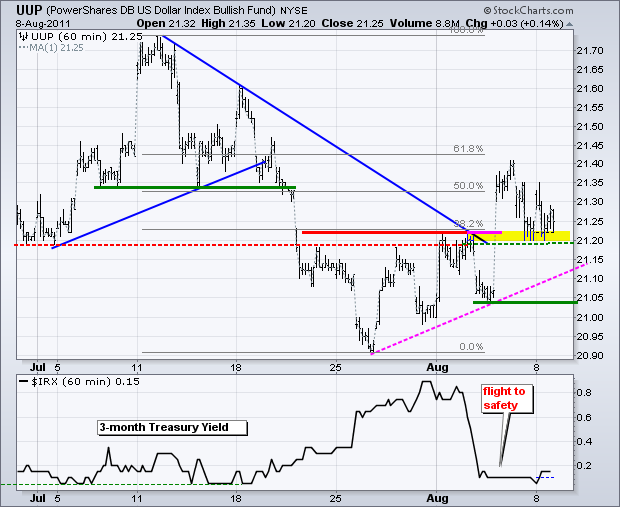
The US Dollar Fund (UUP) was quite weak considering the demand for safety. Currency traders are stuck with two bad options when it comes to the Euro and the Dollar. Perhaps that is why UUP has been stuck in a rut the last few weeks. Overall, the short-term trend is up with the broken resistance zone turning into first support. I am marking key support at the reaction low around 21.03.
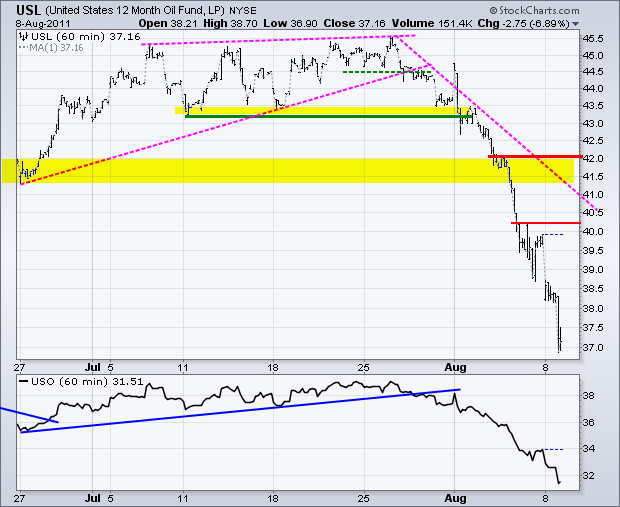
The 12-Month US Oil Fund (USL) chart looks just like the SPY chart. Both are in freefalls. A bounce in oil is dependant on a bounce in the stock market.
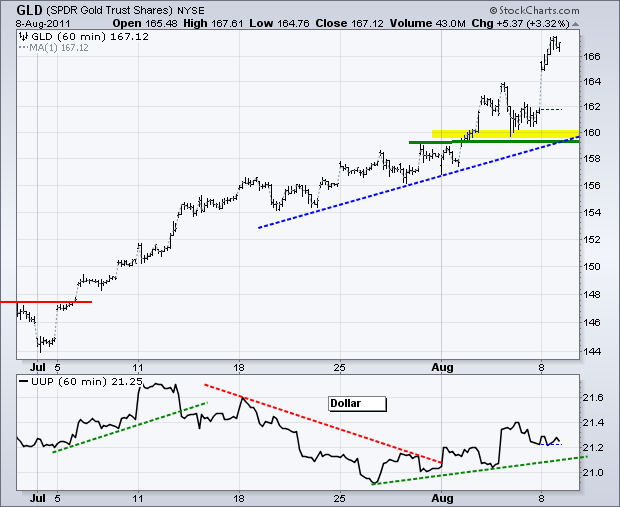
The Gold SPDR (GLD) extended its gains with a gap and move above 166. With this move I am raising support to the 160 area. Last week's reaction low and the trendline extending up from late July mark support here.
Key Economic Reports:
Tue - Aug 09 - 08:30 - Productivity/Labor Costs
Tue - Aug 09 - 14:15 - FOMC Policy Statement
Wed - Aug 10 - 07:00 - MBA Mortgage Index
Wed - Aug 10 - 10:30 - Oil Inventories
Thu - Aug 11 - 08:30 - Jobless Claims
Fri - Aug 12 - 08:30 - Retail Sales
Fri - Aug 12 - 09:55 - Michigan Sentiment
Fri - Aug 12 - 10:00 - Business Inventories
Charts of Interest: Tuesday and Thursday in separate post.
This commentary and charts-of-interest are designed to stimulate thinking. This analysis is not a recommendation to buy, sell, hold or sell short any security (stock ETF or otherwise). We all need to think for ourselves when it comes to trading our own accounts. First, it is the only way to really learn. Second, we are the only ones responsible for our decisions. Think of these charts as food for further analysis. Before making a trade, it is important to have a plan. Plan the trade and trade the plan. Among other things, this includes setting a trigger level, a target area and a stop-loss level. It is also important to plan for three possible price movements: advance, decline or sideways. Have a plan for all three scenarios BEFORE making the trade. Consider possible holding times. And finally, look at overall market conditions and sector/industry performance.

