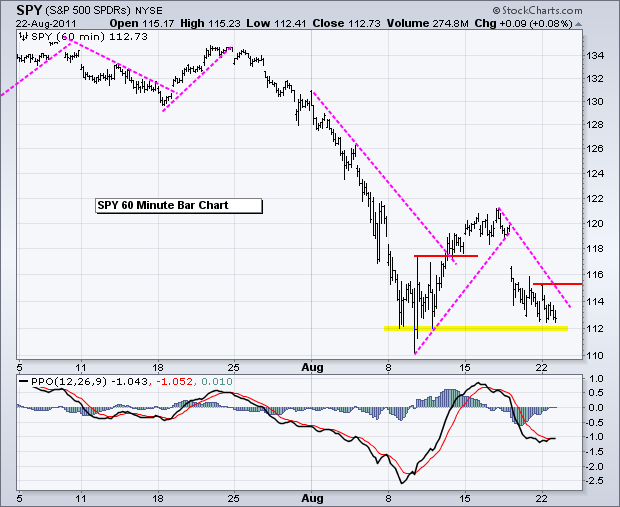
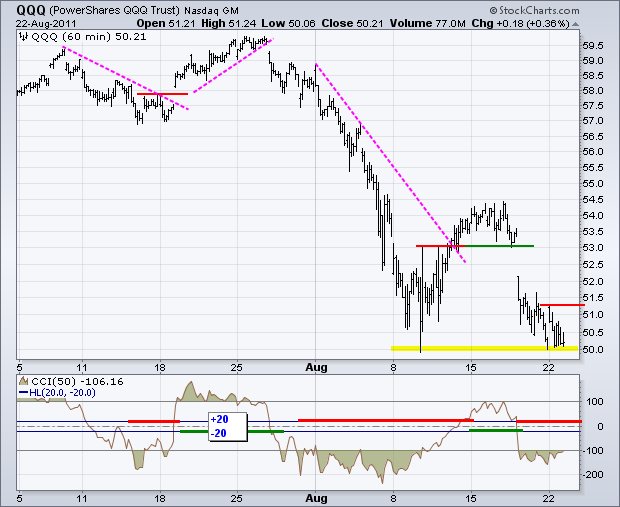
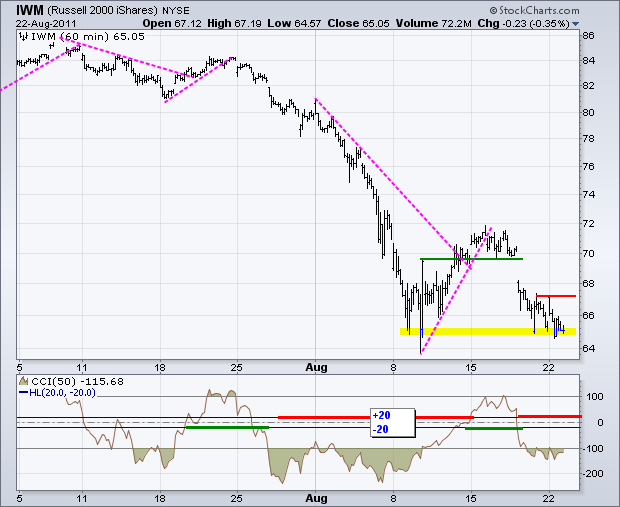
It was pop and drop on Monday. Stocks opened strong, but gains quickly evaporated as selling pressure took over. Even though the major index ETFs closed near their lows for the day, they are still near support from last week's lows and the bulls are chomping at the bit again this morning. Traders may be trying to get a jump on a Bernanke bounce. The Kansas City Fed Conference in Jackson Hole starts Thursday and Bernanke is speaking on Friday at 10AM ET. Technically, the major index ETFs are near potential support levels that could give way to an oversold bounce. Again, I would view any advance from current levels as a bear market bounce. On the SPY chart, the ETF gapped down last week and moved below 114 on Friday. There is support around 112 from last week's low, but the ETF has not been able to hold a bounce. I am lowering first resistance to yesterday's high. A break above this level would provide the first sign of strength. The Percent Price Oscillator (PPO) firmed over the last two days and edged above its signal line, which shows a slight improvement in short-term momentum.
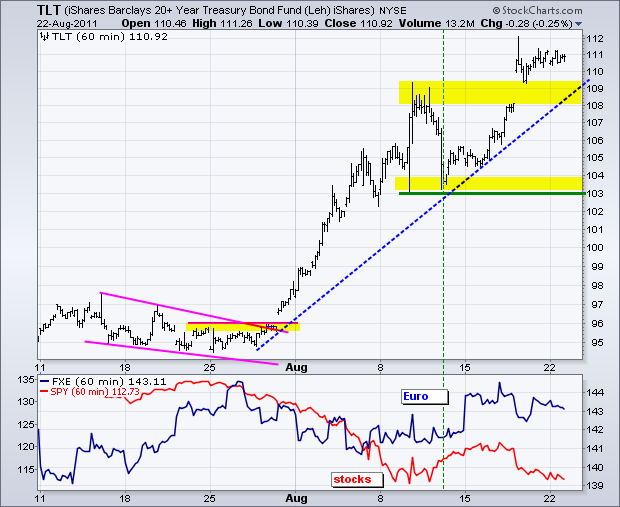
The 20+ year Bond ETF (TLT) gapped above 110 on Thursday and stalled near 111 over the last two days. The August advance in TLT is comparable to the November-December 2008 surge (straight up). Such surges reflect fear in the market and an immediate adjustment for an economic slowdown. The gap and breakout around 108-109 turns into the first support zone to watch on any pullback.
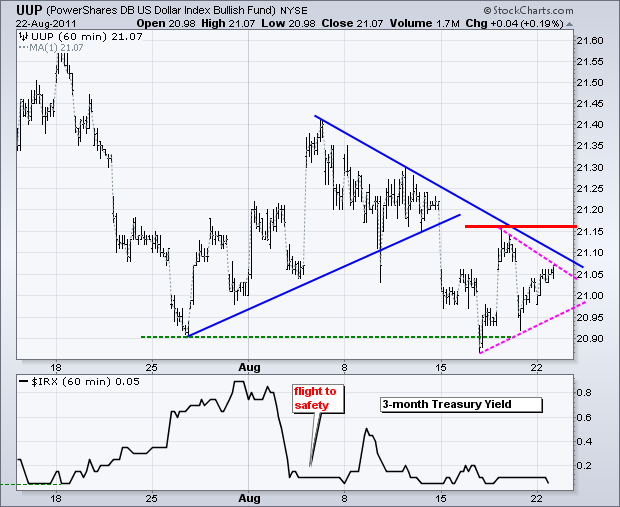
Despite the European debt issues, the Dollar is winning the contest as the ugliest currency right now. Even with the flight to safety and plunge in the stock markets, the US Dollar Fund (UUP) remains well below its July highs. This shows extraordinary weakness. The 2-3 week trend is down with a possible triangle forming the last few days. A break below Friday's low would signal a continuation down for the greenback and a continuation higher for the Euro Currency Trust (FXE).
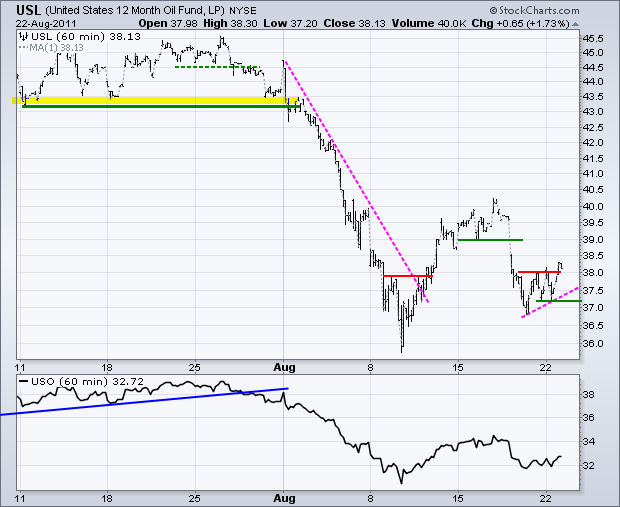
Despite a weak close in the stock market and the prospects of more oil from Libya, the 12-Month US Oil Fund (USL) actually moved higher on Monday. The ETF broke above its first resistance level and is poised to extend its gains on Tuesday. Weakness in the Dollar and strength in stock futures are boosting crude in pre-market trading. First support is marked with the Friday-Monday lows.
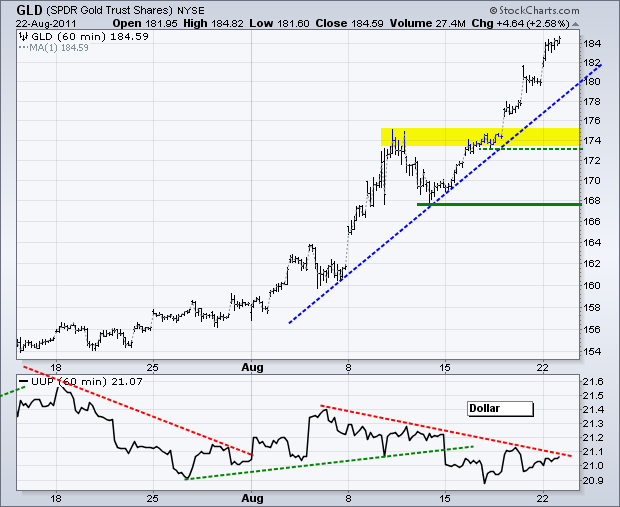
The Gold SPDR (GLD) remains in a strong uptrend, but the advance since July 1st is getting a little parabolic in nature and overextended. Broken resistance around 174 turns into the first support zone.
Key Economic Reports:
Tue - Aug 23 - 10:00 - New Home Sales
Tue - Aug 23 - 07:45 – Chain Store Sales
Wed - Aug 24 - 07:00 - MBA Mortgage Index
Wed - Aug 24 - 08:30 - Durable Good Orders
Wed - Aug 24 - 10:30 - Oil Inventories
Thu - Aug 25 - 08:30 - Jobless Claims
Thu - Aug 25 - 08:30 – Kansas City Fed Conference in Jackson Hole
Fri - Aug 26 - 08:30 - GDP
Fri - Aug 26 - 09:55 - Michigan Sentiment
Fri - Aug 26 – 10:00 – Bernanke Speaks from Jackson Hole
Charts of Interest: Tuesday and Thursday in separate post.
This commentary and charts-of-interest are designed to stimulate thinking. This analysis is not a recommendation to buy, sell, hold or sell short any security (stock ETF or otherwise). We all need to think for ourselves when it comes to trading our own accounts. First, it is the only way to really learn. Second, we are the only ones responsible for our decisions. Think of these charts as food for further analysis. Before making a trade, it is important to have a plan. Plan the trade and trade the plan. Among other things, this includes setting a trigger level, a target area and a stop-loss level. It is also important to plan for three possible price movements: advance, decline or sideways. Have a plan for all three scenarios BEFORE making the trade. Consider possible holding times. And finally, look at overall market conditions and sector/industry performance.

