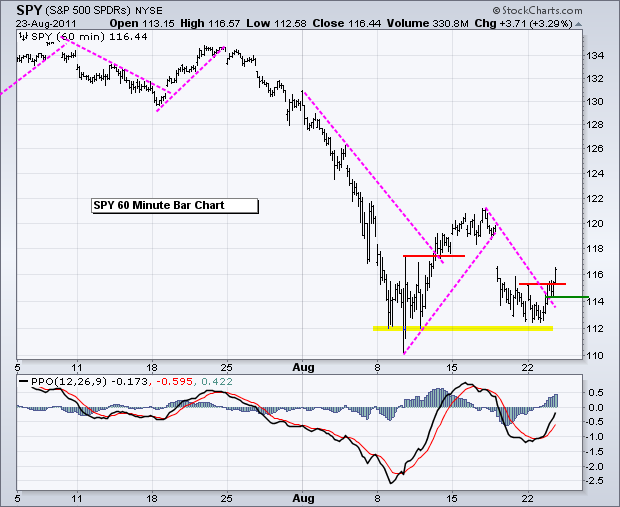
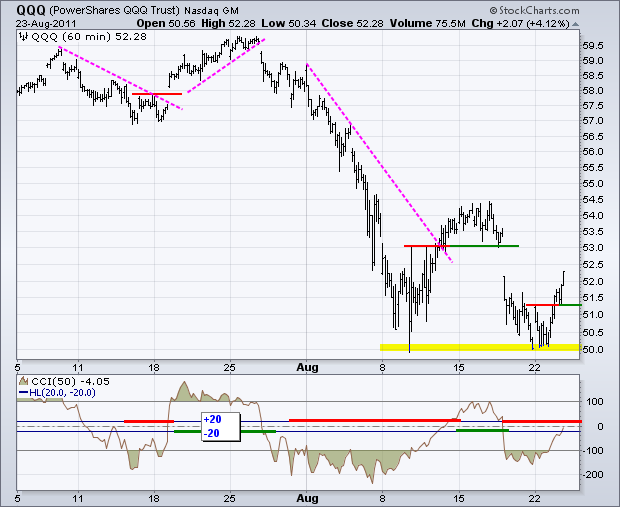
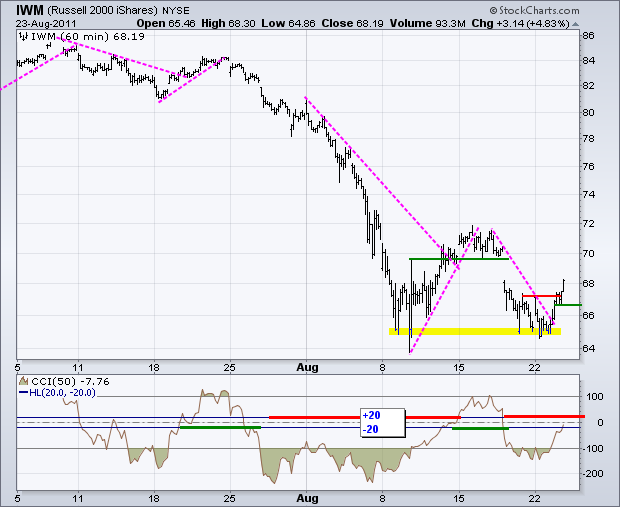
Stocks moved sharply higher on Tuesday with the major index ETFs gaining 3% or more. All sectors were up with energy and consumer discretionary leading the way. Wednesday's move was certainly broad based, but still considered an oversold bounce with a larger downtrend. The first chart shows SPY breaking above Monday's high to start a short-term upswing. I am not sure if a 1-2 week uptrend will take hold because the bigger downtrend could pull trump at anytime. Also note that the markets are still quite skittish with rumors swirling around Bank of America (BAC). The broken trendline and afternoon low combine to mark first support at 114.30. A valid breakout will hold. A head fake will fold. With SPY, QQQ and IWM already well off their lows and Bernanke speaking on Friday, trading could turn choppy on Wednesday and Thursday.
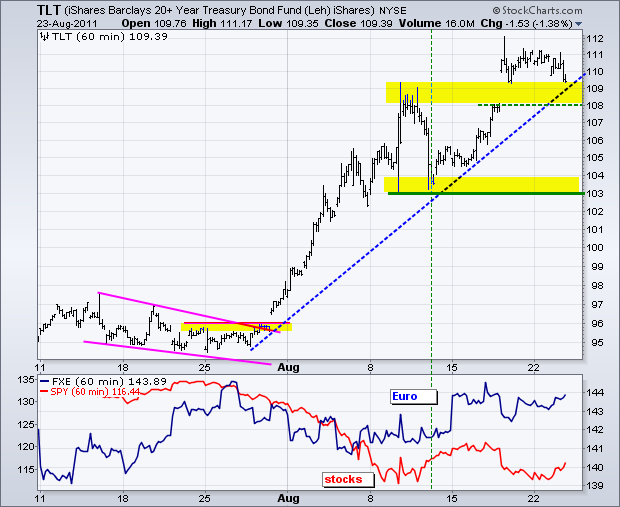
The 20+ year Bond ETF (TLT) stalled over the last three days, but remains in an overall uptrend. The late July trendline, broken resistance and big gap mark first support in the 108-109 area. A break below 108 would argue for a deeper pullback. However, keep in mind that the big trend remains up and pullbacks can be suddenly cut short.
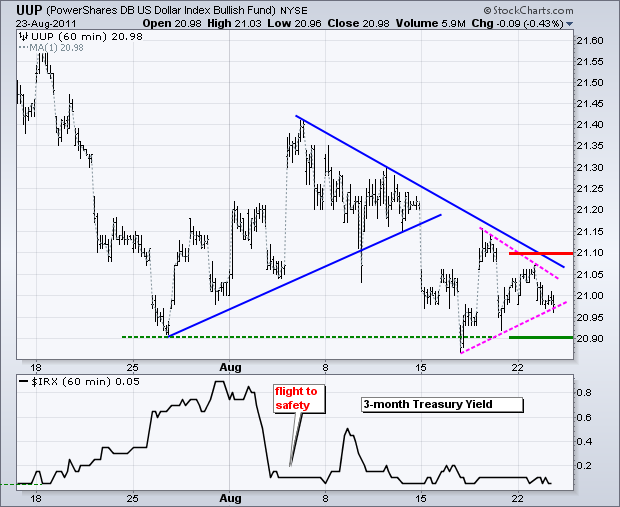
Nobody wants the buy the Dollar and nobody wants to buy the Euro. With the Euro accounting for 57% of the US Dollar Fund (UUP), this means the ETF is stuck between a rock and a hard place. I expected more weakness yesterday, but UUP held support from the late July and early August lows. Nevertheless, the 2-3 week trend remains down with a triangle taking shape the last few days. Watch 20.90 for a downside break and 21.10 for an upside breakout.
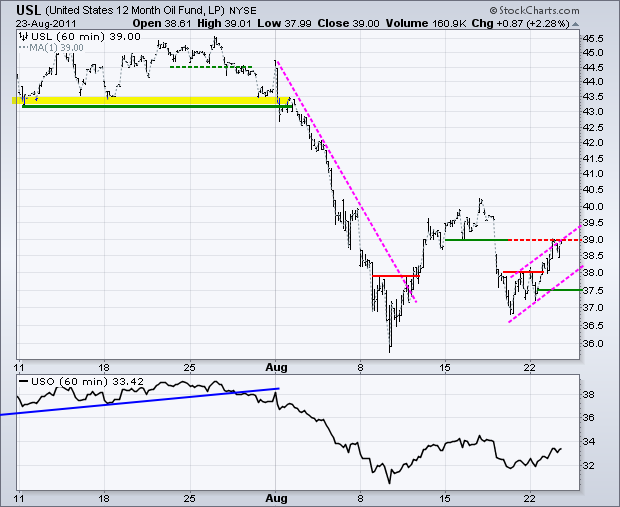
The 12-Month US Oil Fund (USL) extended its gains as the stock market moved sharply higher. As with SPY, this looks like a bear market bounce. USL could conceivably edge above late weeks high and then peak around 41, provided the stock market continues its bounce. This could happen if Bernanke throws the QE3 bone to the market on Friday. The advance over the last few days looks like a rising flag. Although the trendlines are not perfectly parallel, the essence of a rising flag is there (a zigzag bounce after becoming oversold). A break below 37.50 would signal a continuation lower.
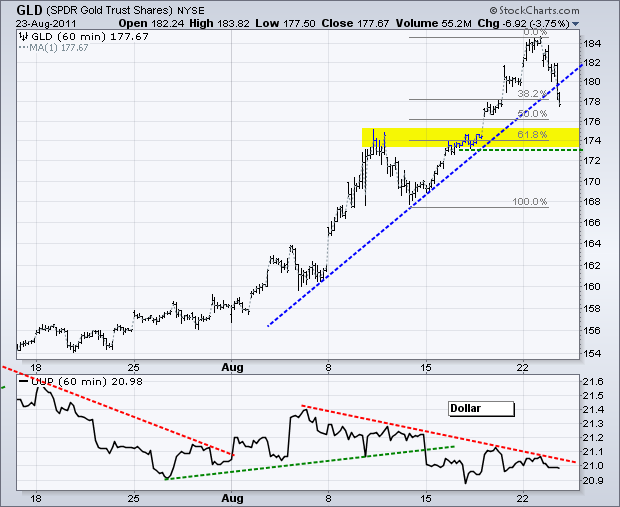
The Gold SPDR (GLD) finally pulled back with a rather sharp decline. This is still considered a correction within a bigger uptrend. We could see some sort of ABC decline that traces out a falling wedge to the 61.80% retracement zone. This support area is confirmed by broken resistance (turned support) in the 174 area. The Dollar and Bernanke made hold the key. A Dollar bearish speech by Bernanke could push the greenback lower and gold higher. Notice how the GLD surge accelerated in early August as the Dollar moved lower.
Key Economic Reports:
Wed - Aug 24 - 07:00 - MBA Mortgage Index
Wed - Aug 24 - 08:30 - Durable Good Orders
Wed - Aug 24 - 10:30 - Oil Inventories
Thu - Aug 25 - 08:30 - Jobless Claims
Thu - Aug 25 - 08:30 – Kansas City Fed Conference in Jackson Hole
Fri - Aug 26 - 08:30 - GDP
Fri - Aug 26 - 09:55 - Michigan Sentiment
Fri - Aug 26 – 10:00 – Bernanke Speaks from Jackson Hole
Charts of Interest: Tuesday and Thursday in separate post.
This commentary and charts-of-interest are designed to stimulate thinking. This analysis is not a recommendation to buy, sell, hold or sell short any security (stock ETF or otherwise). We all need to think for ourselves when it comes to trading our own accounts. First, it is the only way to really learn. Second, we are the only ones responsible for our decisions. Think of these charts as food for further analysis. Before making a trade, it is important to have a plan. Plan the trade and trade the plan. Among other things, this includes setting a trigger level, a target area and a stop-loss level. It is also important to plan for three possible price movements: advance, decline or sideways. Have a plan for all three scenarios BEFORE making the trade. Consider possible holding times. And finally, look at overall market conditions and sector/industry performance.

