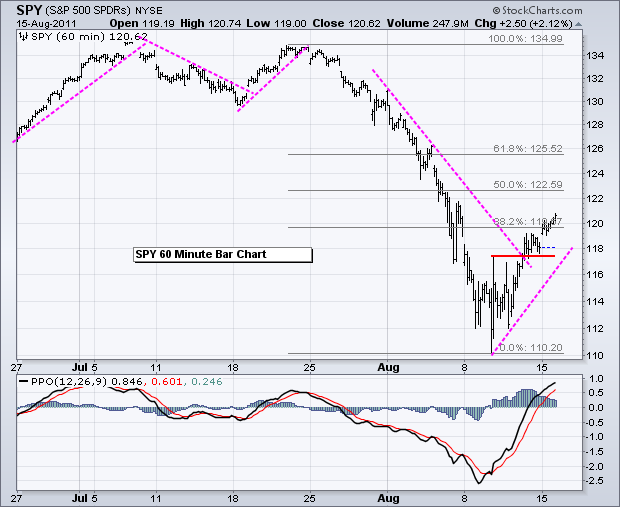
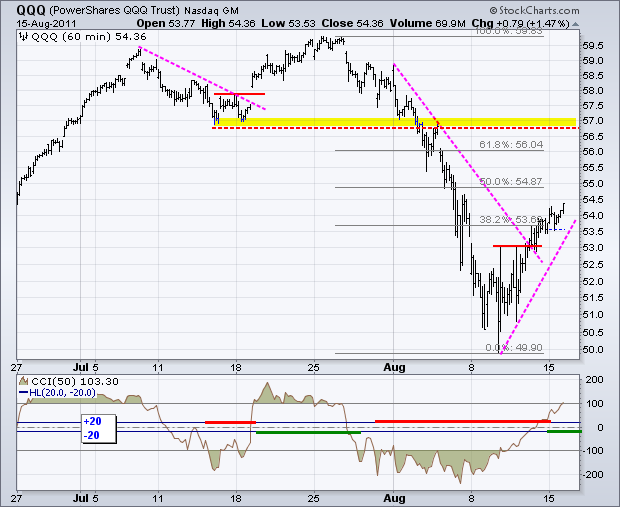
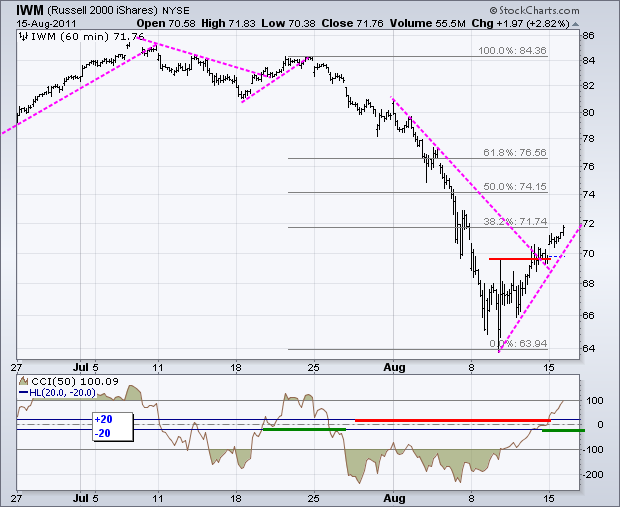
Stocks extended their gains on Monday with strong breadth. All sectors were up 1.4% or more. The Energy, Finance and Utilities SPDRs surged over 3%. NYSE Net Advances Percent hit 81% and Nasdaq Net Advances Percent finished at 61%. The NYSE number was especially strong. We can attribute this to strength in the finance sector. NYSE Net Advancing Volume Percent finished at 93% and Nasdaq Net Advancing Volume Percent ended at 81%. Again, strength today was concentrated on the big board. With another positive breadth surge, we have now seen strong breadth three of the last five days. Even so, nothing has changed on the price charts. The short-term trends are up and this advances are viewed as oversold bounces within a bigger downtrend. I am marking the key retracement zones for targets. SPY and QQQ already exceeded their 38.2% retracements. IWM finished the day right at its 38.2% retracement. The 50% retracements will soon come into play. These levels represent the "base" case for resistance. 38.2% is the low end and 61.80% is the high end.
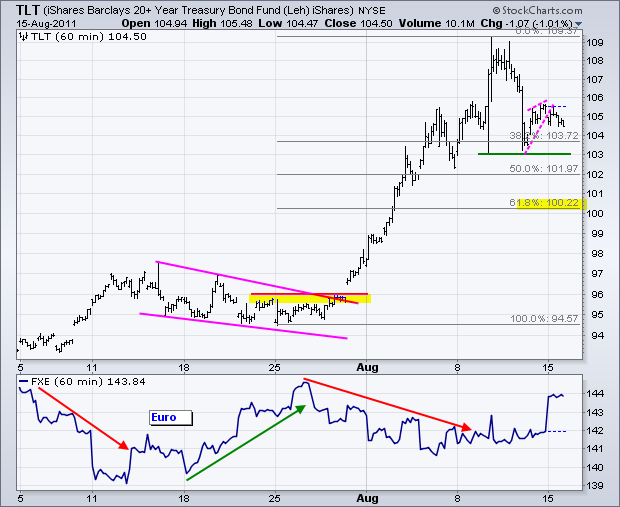
The 20+ year Bond ETF (TLT) weakened on Monday as the appetite for risk remained strong. Stocks and oil were up. Bonds and the Dollar declined. TLT formed a small rising wedge with Friday's bounce and broke below the lower trendline on Monday. Continued strength in stocks and the Euro would weigh on bonds and TLT could reach its 61.80% retracement.
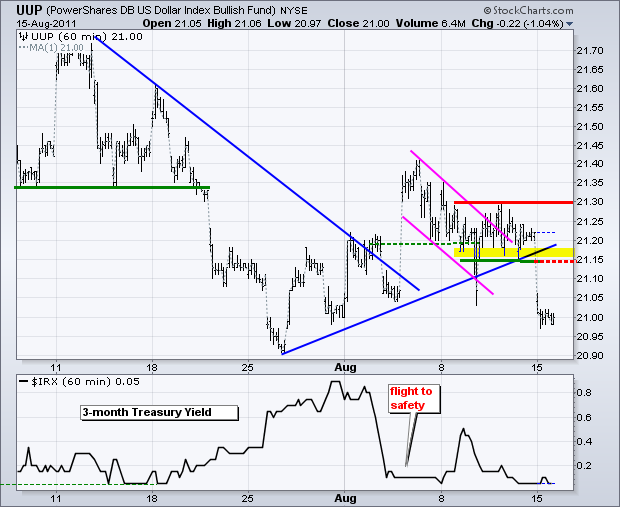
The US Dollar Fund (UUP) broke out of its rut with a clear move below support. This move signals a continuation of the late July decline and affirms resistance at 21.30. Broken support around 21.15-21.20 turns into the first resistance zone to watch.
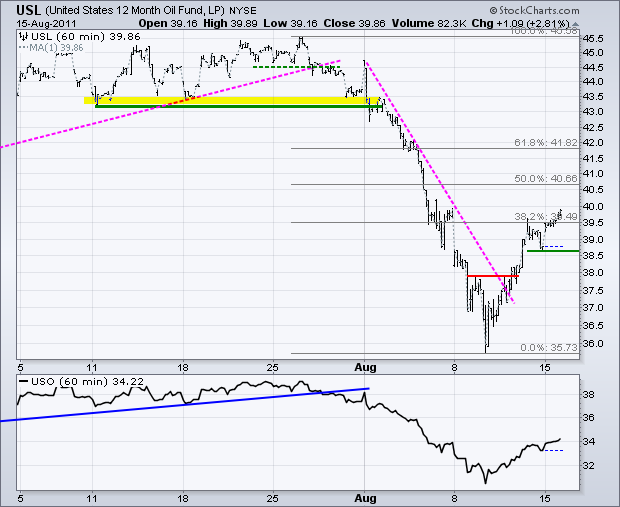
The 12-Month US Oil Fund (USL) followed the stock market higher on Monday. USL has now retraced over 38.2% of the prior decline. With a decline on Friday and pop on Monday, the ETF established a support level at 38.60. A break below this level would be the first sign of a short-term trend reversal.
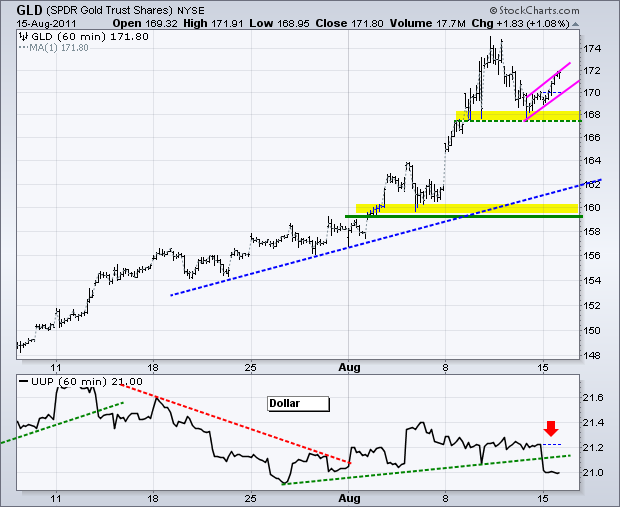
The Gold SPDR (GLD) bounced off support. Weakness in the Dollar did not hurt gold's cause. Continued strength in stocks, weakness in the Dollar and weakness in bonds would be negative for gold. It is a sign of confidence when bonds decline and the Euro rises. A rising flag is taking shape. A break below this pattern would signal a continuation lower and argue for a deeper pullback.
Key Economic Reports:
Tue - Aug 16 - 08:30 - Housing Starts
Tue - Aug 16 - 08:30 - Building Permits
Tue - Aug 16 - 09:15 - Industrial Production
Wed - Aug 17 - 07:00 - MBA Mortgage Index
Wed - Aug 17 - 08:30 - PPI
Wed - Aug 17 - 10:30 - Crude Inventories
Thu - Aug 18 - 08:30 - Initial Claims
Thu - Aug 18 - 08:30 - CPI
Thu - Aug 18 - 10:00 - Existing Home Sales
Thu - Aug 18 - 10:00 - Philadelphia Fed
Thu - Aug 18 - 10:00 - Leading Indicators
Charts of Interest: Tuesday and Thursday in separate post.
This commentary and charts-of-interest are designed to stimulate thinking. This analysis is not a recommendation to buy, sell, hold or sell short any security (stock ETF or otherwise). We all need to think for ourselves when it comes to trading our own accounts. First, it is the only way to really learn. Second, we are the only ones responsible for our decisions. Think of these charts as food for further analysis. Before making a trade, it is important to have a plan. Plan the trade and trade the plan. Among other things, this includes setting a trigger level, a target area and a stop-loss level. It is also important to plan for three possible price movements: advance, decline or sideways. Have a plan for all three scenarios BEFORE making the trade. Consider possible holding times. And finally, look at overall market conditions and sector/industry performance.
