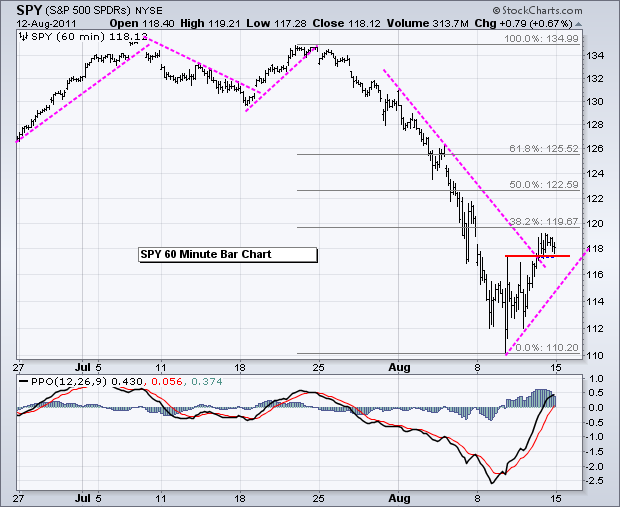
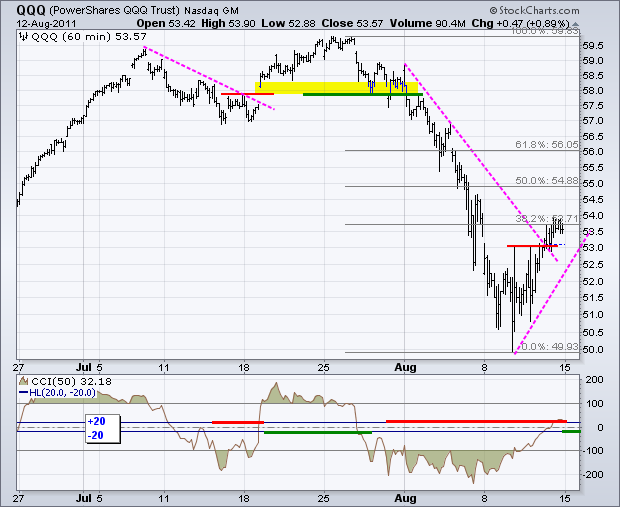
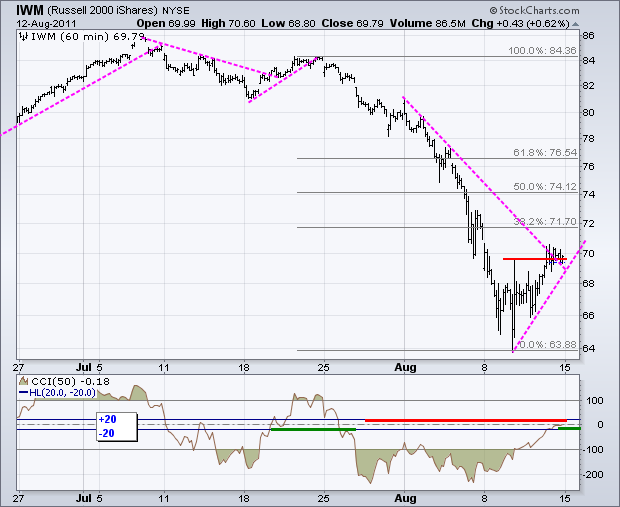
The major index ETFs are now in short-term uptrends as they bounce from oversold levels. SPY tested 112 on Monday and Wednesday with an intraday dip to 110.5 in between (Tuesday). An inverse Head-and-Shoulders formed these three days and the ETF broke above the Tuesday-Wednesday highs with Thursday's strong gain. Breadth on Tuesday and Thursday was extraordinarily strong. Net Advances and Net Advancing Volume on both the NYSE and Nasdaq surged to their highest levels of the year ($NYAD, $NYUD, $NAAD, $NAUD). Yes, we have seen positive breadth surges that usually signal the start of a sustained advance. As far as SPY and the major index ETFs are concern, the 50% retracements mark the middle targets for this bounce. A 50% retracement of the decline from 22-Jul to 9-Aug would extend to the 122.59 area. It is also possible to measure the Fibonacci Retracements Tool from the 7-Jul high. This would make the upside targets a little higher.
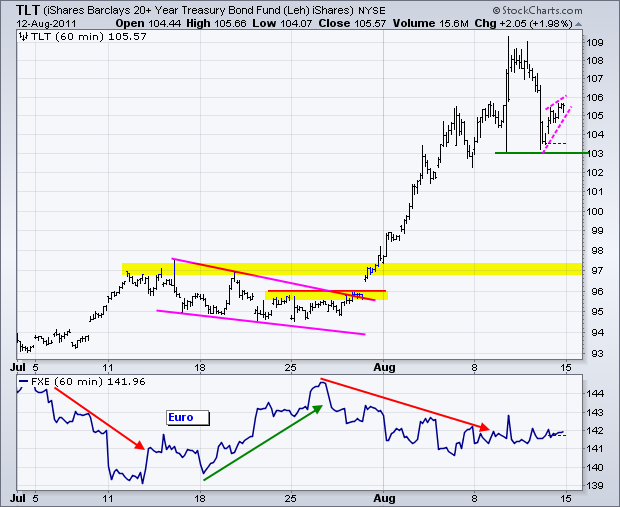
The 20+ year Bond ETF (TLT) took a big hit on Thursday, but found support at 103 and bounced with a small rising wedge. This pattern could be just an oversold bounce in preparation for a continuation lower. Bonds are still a bit overbought and could correct further if the stock market extends its rally.
The US Dollar Fund (UUP) is still stuck between a rock and a hard place. Admittedly, the ETF could easily go either way at this point. I am raising key support to 21.15 and key resistance remains at 21.30. A slight uptrend is present with the rise since late July. A break above this week's high would argue for another leg higher, which would be negative for stocks. It all depends on the Euro, which accounts for around 57% of the US Dollar Index.

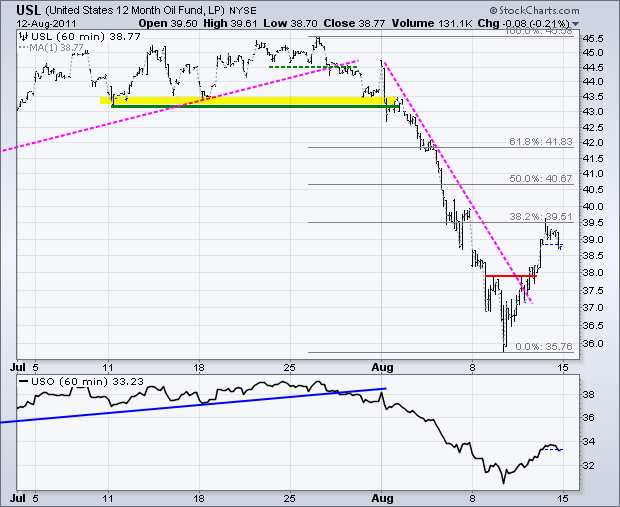
The 12-Month US Oil Fund (USL) retraced 38.2% of the prior decline with a bounce back to 39.5 last week. The short-term downtrend reversed with the trendline break and strength in the stock market. I would still expect oil to follow stocks. Further strength in stocks would be bullish for crude, while weakness would weigh.
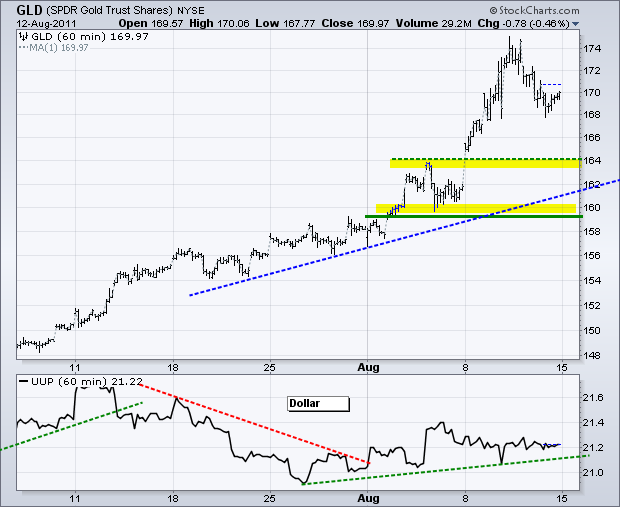
The Gold SPDR (GLD) corrected as money moved back into stocks and out of bonds. Gold was overbought above 174 and could correct back to broken resistance around 164.
Key Economic Reports:
Mon - Aug 15 - 08:30 - Empire Manufacturing
Mon - Aug 15 - 10:00 - NAHB Housing Market Index
Tue - Aug 16 - 08:30 - Housing Starts
Tue - Aug 16 - 08:30 - Building Permits
Tue - Aug 16 - 09:15 - Industrial Production
Wed - Aug 17 - 07:00 - MBA Mortgage Index
Wed - Aug 17 - 08:30 - PPI
Wed - Aug 17 - 10:30 - Crude Inventories
Thu - Aug 18 - 08:30 - Initial Claims
Thu - Aug 18 - 08:30 - CPI
Thu - Aug 18 - 10:00 - Existing Home Sales
Thu - Aug 18 - 10:00 - Philadelphia Fed
Thu - Aug 18 - 10:00 - Leading Indicators
Charts of Interest: Tuesday and Thursday in separate post.
This commentary and charts-of-interest are designed to stimulate thinking. This analysis is not a recommendation to buy, sell, hold or sell short any security (stock ETF or otherwise). We all need to think for ourselves when it comes to trading our own accounts. First, it is the only way to really learn. Second, we are the only ones responsible for our decisions. Think of these charts as food for further analysis. Before making a trade, it is important to have a plan. Plan the trade and trade the plan. Among other things, this includes setting a trigger level, a target area and a stop-loss level. It is also important to plan for three possible price movements: advance, decline or sideways. Have a plan for all three scenarios BEFORE making the trade. Consider possible holding times. And finally, look at overall market conditions and sector/industry performance.

