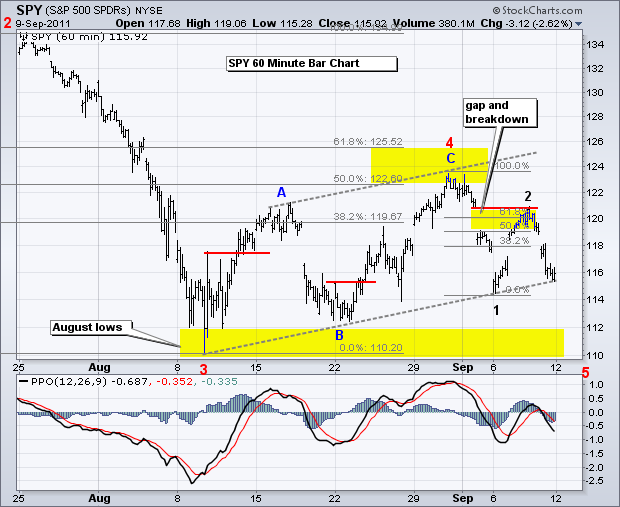
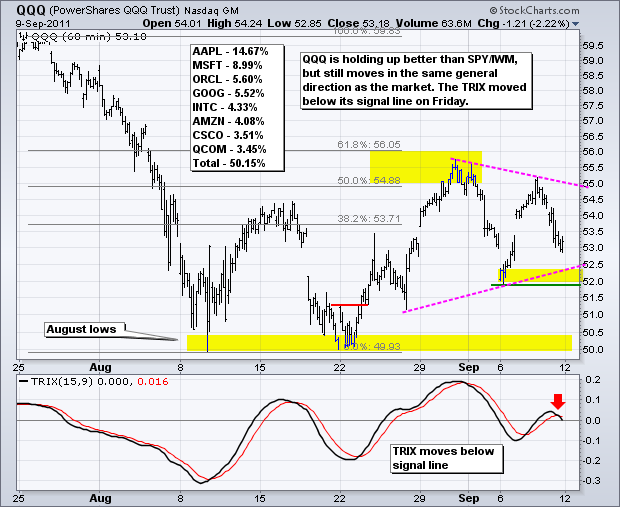
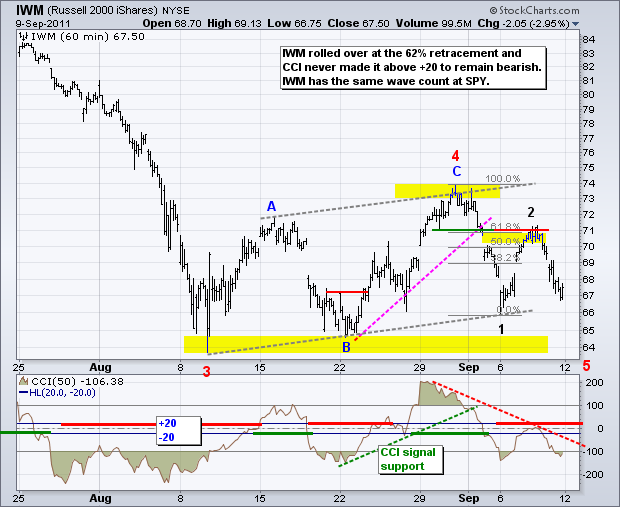
European banks are in the spot light on Monday. First, speculation is rising that Greece will finally default. Second, the debt agencies are poised to downgrade a number of European (mainly French) banks. Third, there is a clear rift in the European Central Bank (ECB) after the surprise resignation of Juergen Stark on Friday. Fourth, funding costs are rising for cash strapped EU banks. Fifth, the Euro plunged again on Monday. It is a bearish recipe for US stocks, which are poised to open sharply lower. The S&P 500 ETF (SPY) has been playing out a 5-wave decline sequence to perfection over the last two months. The August advance marked an ABC zigzag for Wave-4 and Wave-5 started with the early September decline (Wave 1 of 5). There was a bounce after Labor Day (Wave 2 of 5), but this bounce hit resistance at the 61.80% retracement and SPY continued lower on Thursday-Friday (Wave 3 of 5). Third Waves are often the strongest and the longest of the five impulse waves. This means a move below the August low can be expected before a Wave-4 bounce. Yep, it looks ugly. My best guess is that this decline will ultimately end with some sort of selling climax that reaches the 105 area (1050 $SPX) on the low.
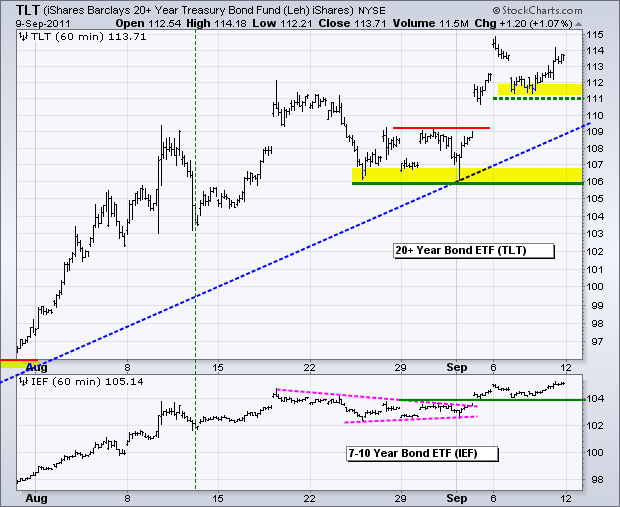
The 20+ year Bond ETF (TLT) is likely to benefit from a flight to safety today. On the price chart, TLT held first support at 111 and edged higher on Friday. This is the first level to watch. Key support remains at 106.
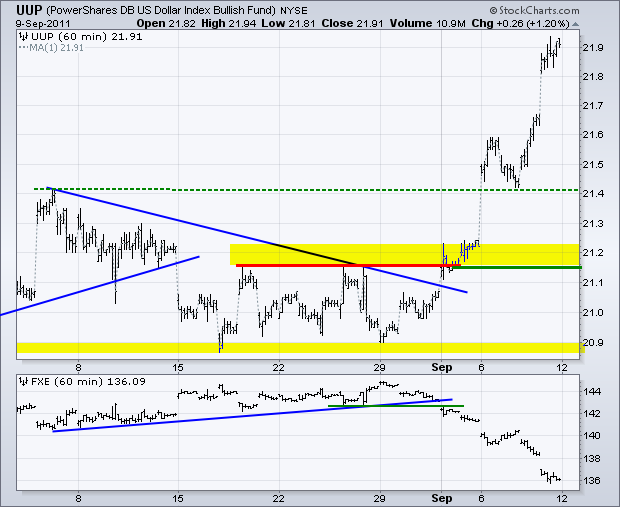
The US Dollar Fund (UUP) is rising fast. It is as if the FOREX world has moved from one side of the ship to the other at once. Traders are rushing out of the Euro, which is causing a rise in the Dollar. The greenback is also benefitting as a relative safe-haven currency. The move is too sharp for much analysis on the 30-minute chart. Longer term, UUP broke above its May high last week and the January high marks next resistance in the 23.35 area.
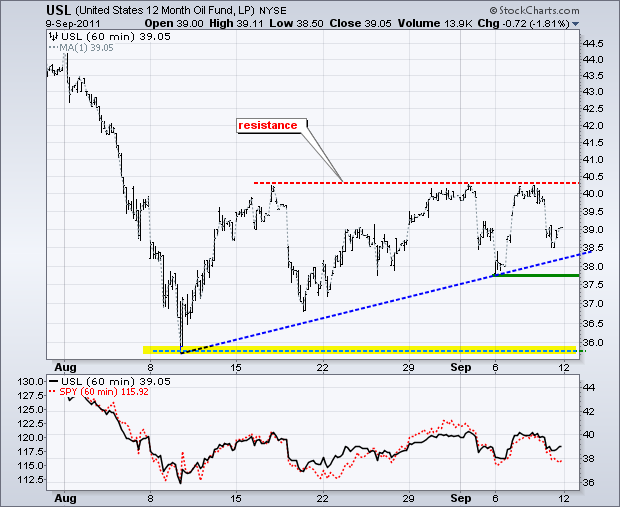
The 12-Month US Oil Fund (USL) is under pressure this morning as money moves in risk-off mode. The Ascending Triangle is not going to work because USL is not going to break its August-September highs. Instead, we are going to see a break below the early September low and target a move to the August low around 36.
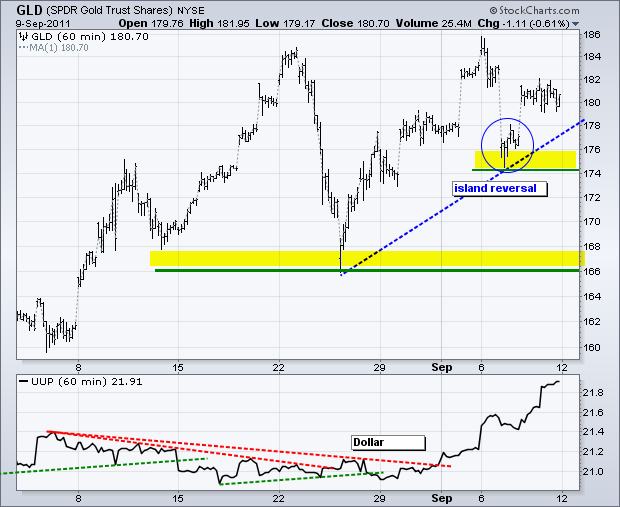
Gold futures are down as of this writing (5AM ET). That does not mean they will stay down, but a down day for gold in the face of meltdowns elsewhere would be a negative sign for bullion. Gold should rise when stocks, oil and the Euro are down sharply. The Gold SPDR (GLD) shows a surge above 180 and consolidation. Even though stocks and the Euro fell sharply on Friday, gold did not rise and is already showing signs of fatigue. First support is set at 174.
Key Economic Reports:
Wed - Sep 14 - 07:00 - MBA Mortgage Index
Wed - Sep 14 - 08:30 - PPI
Wed - Sep 14 - 08:30 - Retail Sales
Wed - Sep 14 - 10:00 - Business Inventories
Wed - Sep 14 - 10:30 - Oil Inventories
Thu - Sep 15 - 08:30 - Jobless Claims
Thu - Sep 15 - 08:30 - CPI
Thu - Sep 15 - 08:30 - Empire State Manufacturing
Thu - Sep 15 - 09:15 - Industrial Production
Thu - Sep 15 - 09:15 - Capacity Utilization
Thu - Sep 15 - 16:00 - Fed Balance Sheet/Money Supply
Thu - Sep 15 - 10:00 - Philadelphia Fed
Fri - Sep 16 - 09:00 - Net Long-Term TIC Flows
Fri - Sep 16 - 09:55 - Michigan Sentiment
Charts of Interest: Tuesday and Thursday in separate post.
This commentary and charts-of-interest are designed to stimulate thinking. This analysis is not a recommendation to buy, sell, hold or sell short any security (stock ETF or otherwise). We all need to think for ourselves when it comes to trading our own accounts. First, it is the only way to really learn. Second, we are the only ones responsible for our decisions. Think of these charts as food for further analysis. Before making a trade, it is important to have a plan. Plan the trade and trade the plan. Among other things, this includes setting a trigger level, a target area and a stop-loss level. It is also important to plan for three possible price movements: advance, decline or sideways. Have a plan for all three scenarios BEFORE making the trade. Consider possible holding times. And finally, look at overall market conditions and sector/industry performance.

