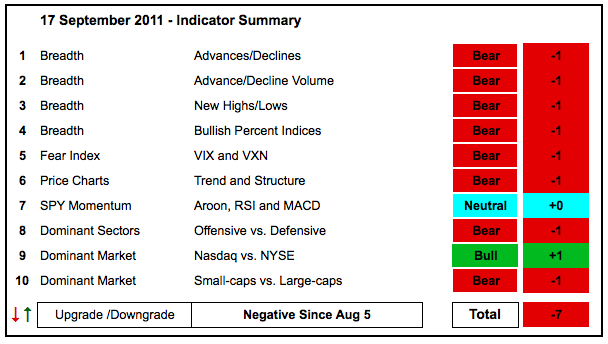
The indicator summary remains unchanged. Except for the Nasdaq 100 ETF (QQQ) and large techs, stocks have been moving sideways the last several weeks. QQQ is trading at its highest level since August 3rd, but the other major index ETFs remain below their August 31st highs. The same can be said for the Finance SPDR (XLF), Industrials SPDR (XLI) and Consumer Discretionary SPDR (XLY). A flat trend after a sharp decline does not change anything. The bulk of the 2-6 month evidence continues to favor the bears.
- AD Lines: Bearish. The Nasdaq AD Line peaked remains in a clear downtrend with falling peaks/troughs since March-April. The NYSE AD Line is holding up better as it works its way higher since early August. However, I still view the early August support break as bearish and the current bounce as a bear market bounce.
- AD Volume Lines: Bearish. The Nasdaq AD Volume Line edged above its mid August high, thanks for large-cap tech stocks. The NYSE AD Volume Line remains below this high and shows relative weakness, thanks to big banks. These two are still bearish overall.
- Net New Highs: Bearish. The Cumulative Net New Highs Lines remain below their 10-day EMAs and in downtrends since early August. The 10-day SMAs of Net New Highs are also negative. Selling pressure is winning when there are more new lows than new highs.
- Bullish Percent Indices: Bearish. Four of nine BPIs are below 50%, four are above 50% and one is right at 50% (healthcare). It is a bit split with the technology and industrials sectors just above 50% and the consumer discretionary and finance sectors below 50%. These two are more below 50% than the other two are above 50% so I will stay bearish on this indicator.
- VIX/VXN: Bearish. The CBOE Volatility Index ($VIX) and the Nasdaq 100 Volatility Index ($VXN) broke above 25 in late July and held above 30 since early August. Fear remains at relatively high levels and this is bearish.
- Trend Structure: Bearish. DIA, IWM, MDY, QQQ and SPY broke below their March-June lows to start downtrends in early August. QQQ has moved back above this support break, but the other four have yet to follow suit. In fact, the other four also remain below their August 31st highs.
- SPY Momentum: Neutral. RSI moved into the 50-60 zone, which acts as resistance in a downtrend and MACD(5,35,5) remains in negative territory. No breakouts here. The Aroon Oscillator (20), however, surged above 50 to turn bullish.
- Offensive Sector Performance: Bearish. Techs are perking up the last few weeks, but the industrials, consumer discretionary and finance sectors remain in the doldrums.
- Nasdaq Performance: Bullish. The $COMPQ:$NYA ratio hit a 52-week high this month as the Nasdaq outperforms the NY Composite. Thank you Apple, Amazon and a few other large-cap tech stocks.
- Small-cap Performance: Bearish. The $RUT:$OEX ratio broke down in late July and early August. This Price Relative firmed the last few weeks, but remains in a downtrend overall. Small-caps still show relative weakness.
- Breadth Charts (here) and Inter-market charts (here) have been updated.
This table is designed to offer an objective look at current market conditions. It does not aim to pick tops or bottoms. Instead, it seeks to identify noticeable shifts in buying and selling pressure. With 10 indicator groups, the medium-term evidence is unlikely to change drastically overnight.

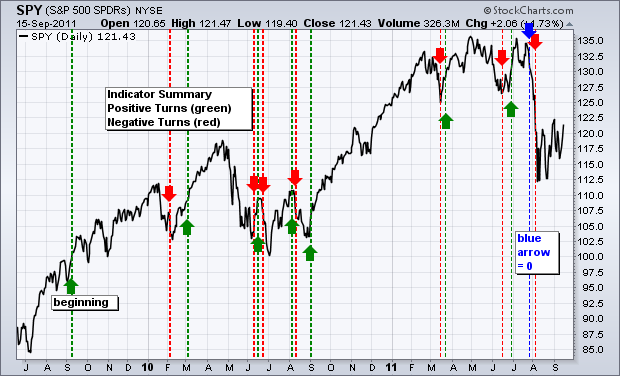
Previous turns include:
Positive on 11-Sept-09
Negative on 5-Feb-10
Positive on 5-March-10
Negative on 11-Jun-10
Positive on 18-Jun-10
Negative on 24-Jun-10
Positive on 6-Aug-10
Negative on 13-Aug-10
Positive on 3-Sep-10
Negative on 18-Mar-11
Positive on 25-Mar-11
Negative on 17-Jun-11
Positive on 30-Jun-11
Neutral on 29-Jul-11
Negative on 5-August-11


