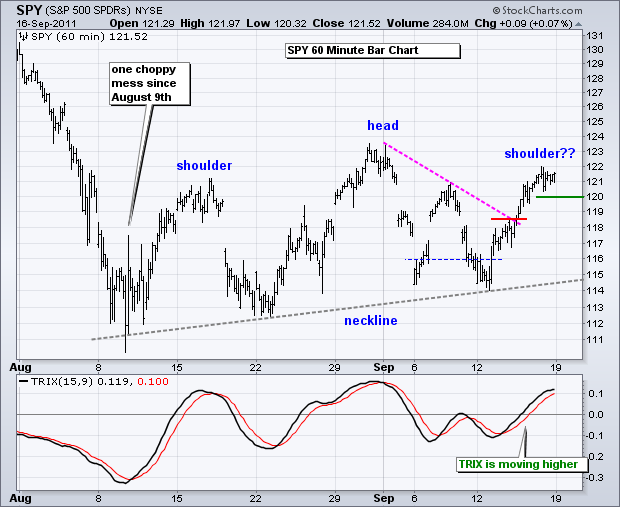
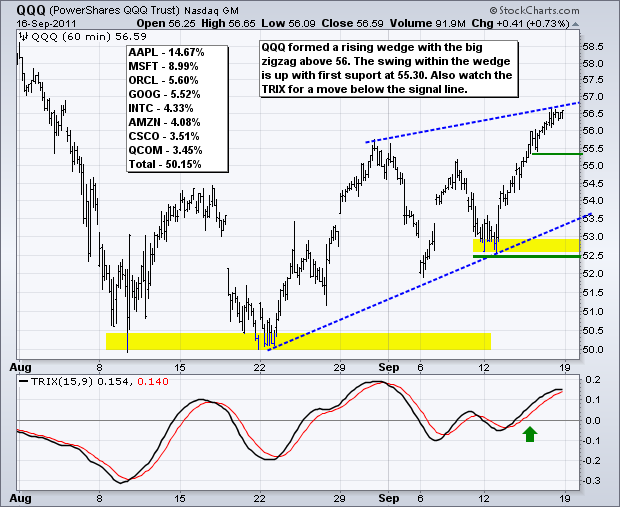
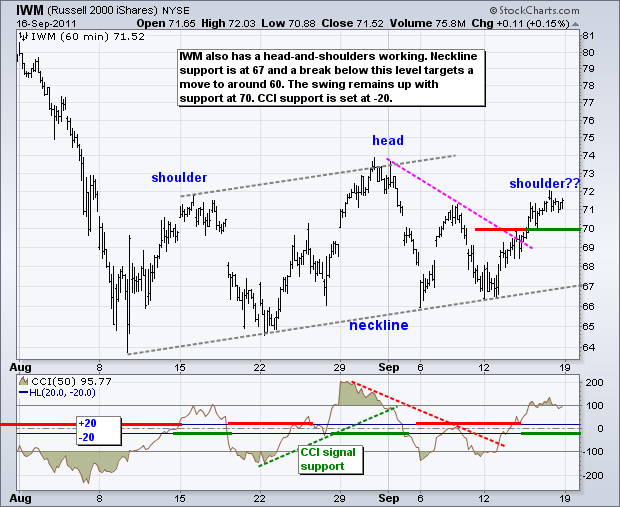
It could be a wild week in the markets. First, stock futures are pointing to a sharply lower open. The Euro and oil are trading lower, while bonds and the Dollar are trading higher. Second, the Fed starts its two-day meeting on Tuesday with a policy statement on Wednesday afternoon. Third, the S&P 500 ETF (SPY) is trading near its mid August high with what looks like a Head-and-Shoulders pattern since early August. Yes, Head-and-Shoulders patterns can be continuation or reversal. The current pattern amounts to one big consolidation after the August decline. A consolidation after a sharp decline favors a continuation of that decline. The left shoulder formed in mid August, the head in late August and the right shoulder could be peaking now. Neckline support is around 114-115. A break below this level targets a move to the 104.50 area. The height of the pattern (±10) is subtracted from the neckline break (114.5) for a target. Momentum-wise, the TRIX is currently rising, but a move below the signal line would turn this momentum oscillator bearish. In keeping with the tight-leash strategy, I am raising short-term support to 120. This level will likely be broken on the open and I would then set initial resistance at 122.
*************************************************
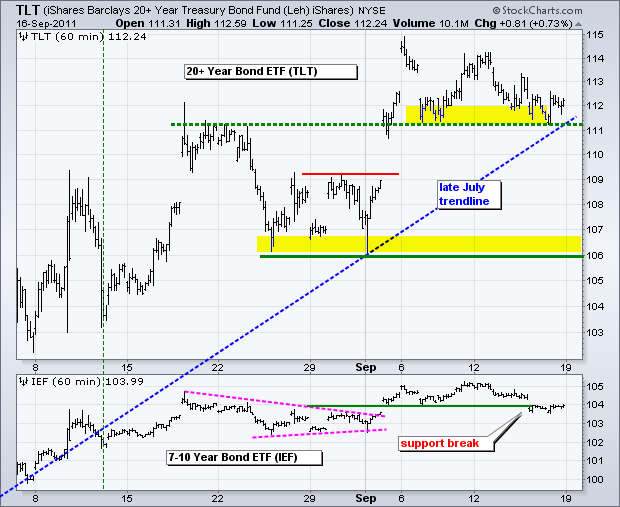
The 20+ year Bond ETF (TLT) continues to hold support at 111 as the Fed meeting looms this week. Support in the 111 area stems from broken resistance, the early September lows and the late July trendline. The long-bond is the subject of this week's Fed meeting as the FOMC considers extending its buy program to the long end of the curve. Such a QE3 announcement would be bullish for TLT, as would further weakness in stocks.
*************************************************
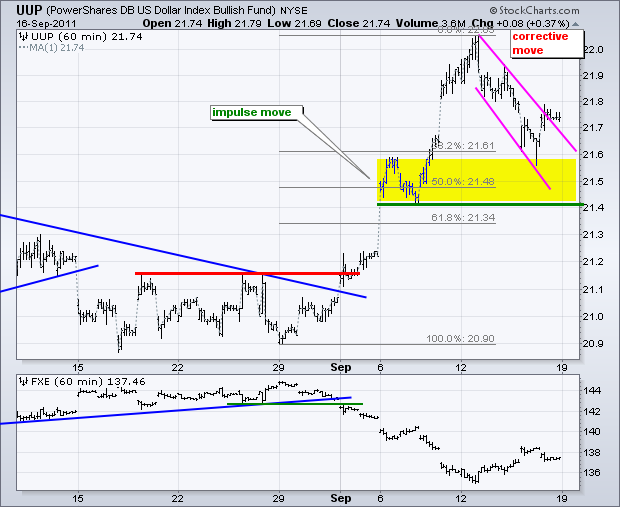
The US Dollar Fund (UUP) got some of its mojo back on Friday and is trading higher in the futures market this morning. On the price chart, the decline to the 21.55 area was viewed as a correction after an impulse move higher. The ETF broke above the upper trendline Friday and will reinforce this break with further gains today. I am raising key support to the 21.40-21.60 area.
*************************************************
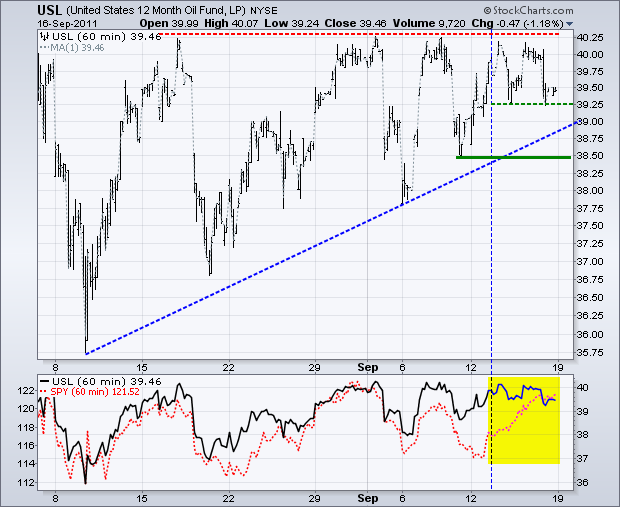
Oil has not been keeping pace with the stock market since September 13th. The indicator window shows the 12-Month US Oil Fund (USL) and the S&P 500 ETF (SPY). SPY surged last week, but USL hit resistance and traded flat. With SPY moving above its early September high, oil should have broken resistance as well. Instead, USL closed down on Friday and is poised to break first support at 39.25. Further weakness below 38.50 would break the early August trendline and key support.
*************************************************
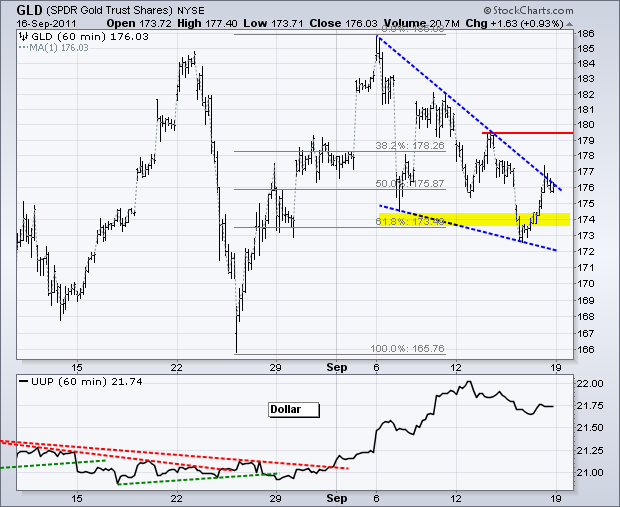
The Gold SPDR (GLD) is in a downtrend after breaking support last week, but this decline is starting to look like a falling wedge. First, the long-term trend for GLD is up on the weekly chart. Second, notice that this wedge retraced around 61.80% of the prior advance. Third, GLD moved right back above the support break to set a bear trap (failed support break). The wedge is still falling with resistance in the 179.50 area. A move above this level would reverse the two week downtrend and call for a continuation higher.
Key Economic Reports:
Tue - Sep 20 - 08:30 - Housing Starts-Building Permits
Tue - Sep 20 - 08:30 - FOMC Meeting Begins
Wed - Sep 21 - 07:00 - MBA Mortgage Index
Wed - Sep 21 - 10:00 - Existing Home Sales
Wed - Sep 21 - 10:30 - Crude Inventories
Wed - Sep 21 - 14:15 - FOMC Policy Statement
Thu - Sep 22 - 08:30 - Initial Claims
Thu - Sep 22 - 10:00 - Leading Indicators
Charts of Interest: Tuesday and Thursday in separate post.
This commentary and charts-of-interest are designed to stimulate thinking. This analysis is not a recommendation to buy, sell, hold or sell short any security (stock ETF or otherwise). We all need to think for ourselves when it comes to trading our own accounts. First, it is the only way to really learn. Second, we are the only ones responsible for our decisions. Think of these charts as food for further analysis. Before making a trade, it is important to have a plan. Plan the trade and trade the plan. Among other things, this includes setting a trigger level, a target area and a stop-loss level. It is also important to plan for three possible price movements: advance, decline or sideways. Have a plan for all three scenarios BEFORE making the trade. Consider possible holding times. And finally, look at overall market conditions and sector/industry performance.

