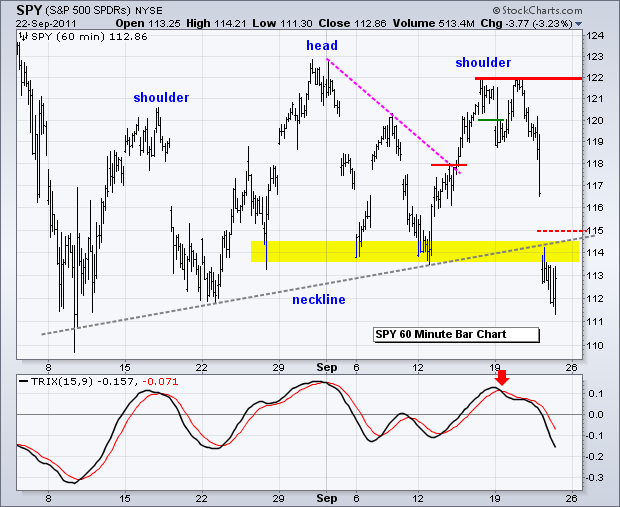
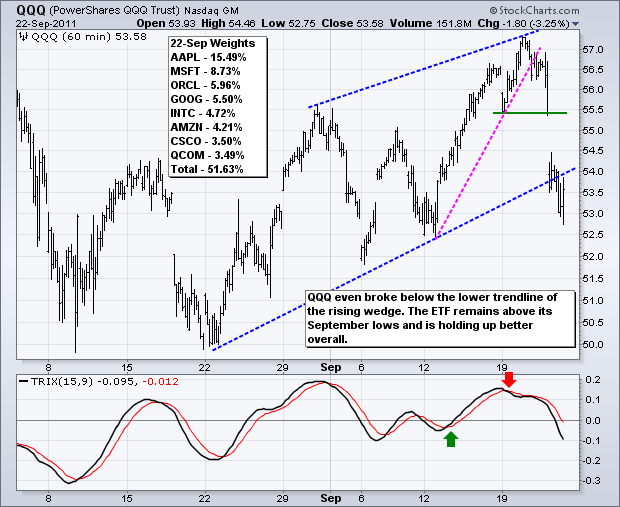
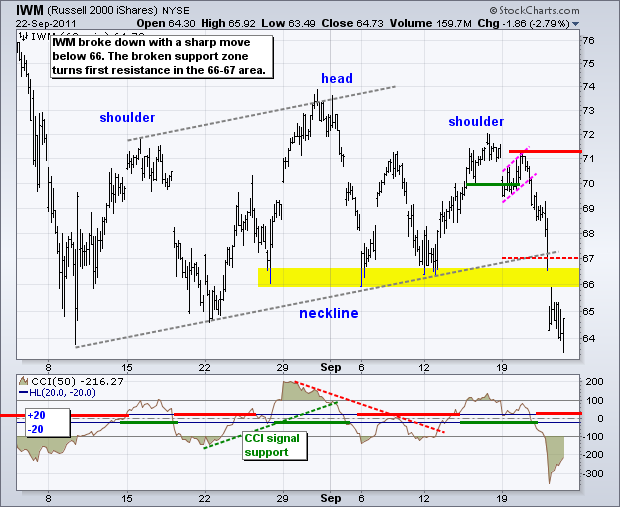
Looks like everyone ran for the exit at the same time, whatever the reason. The S&P 500 ETF (SPY) broke below the early September lows with a plunge below 112 intraday. There was a big gap below 114, an intraday dip below 112 and a last hour surge to around 113. At this point, the ETF is short-term oversold, but by no means bullish. Oversold simply means that the decline has been exceptional. We do not need a momentum oscillator for this judgment. SPY fell 8% from high to low in less than three days. Broken supports and the neckline mark the first resistance zone in the 114 area.
**************************************************************************
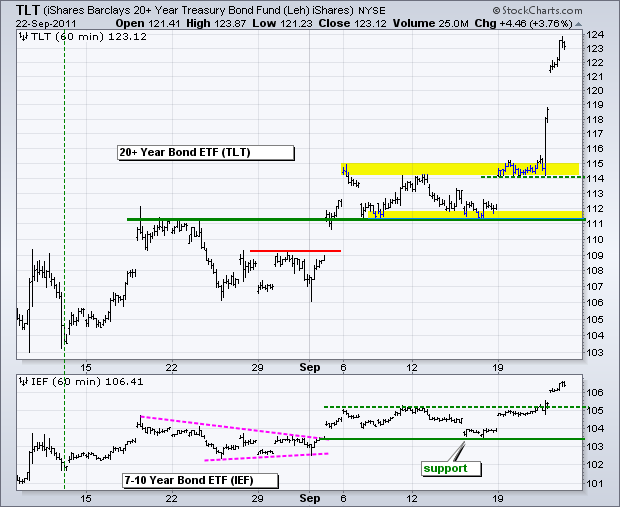
The 20+ year Bond ETF (TLT) surged yet again. This move is getting obscenely overbought. TLT is up +10% for the week and ±32% since early July. This is 2008 all over again. Money is seeking safety, not return. Broken resistance turns first support in the 114-115 area.
**************************************************************************
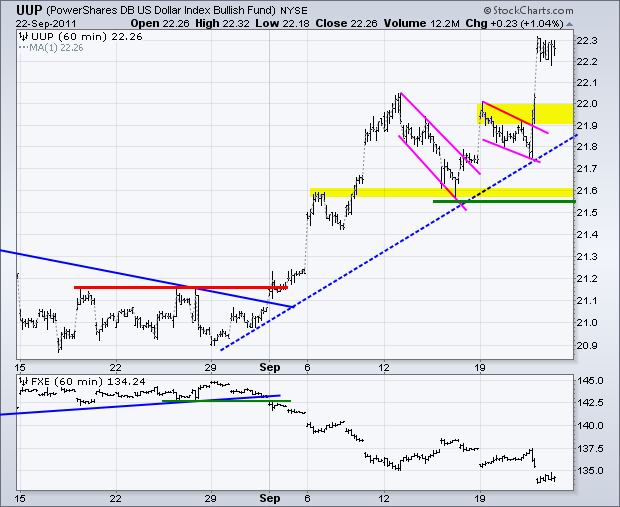
The US Dollar Fund (UUP) extended its surge with an opening move above 22.20. The ETF consolidating after this surge and remains in a clear uptrend. Broken resistance levels around 21.90-22 turn into first support. I am setting key support at 21.55, which is based on last week's low.
**************************************************************************
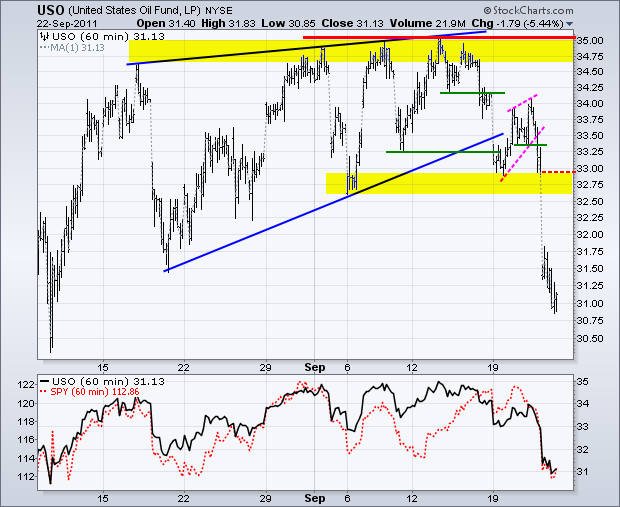
The US Oil Fund (USO) broke down on Wednesday afternoon and plunged on Thursday. USO fell more than the stock indices. This is no doubt a reaction to weakness in stocks and the prospects of slower economic growth (globally). Broken support turns into the first resistance zone in the 32.75 area.
**************************************************************************
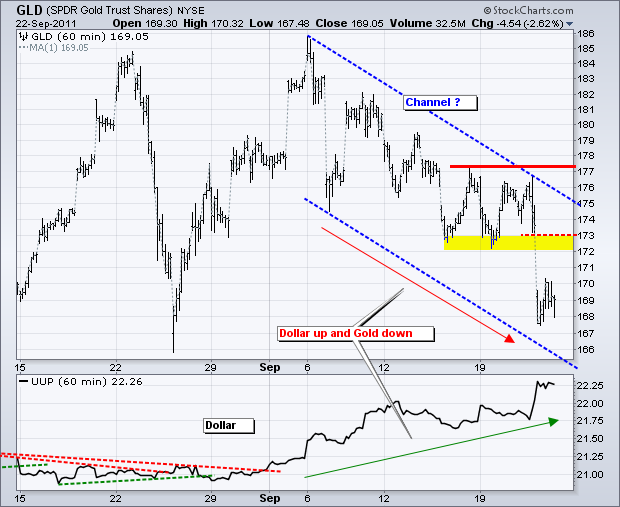
The Dollar has been moving higher since early September and gold has been moving lower. This is the best explanation I can find for the sharp decline in gold. The Gold SPDR (GLD) is approaching the late August lows around 166. It is possible that a falling channel is taking shape with the lower trendline extending to the 165 area in the next few days. Broken support in the 172-173 area turns into the first resistance zone. Key resistance remains just above 177.
Key Economic Reports:
Fri - Sep 23 - 07:00 – TGIF – make mine a double!
Charts of Interest: Tuesday and Thursday in separate post.
This commentary and charts-of-interest are designed to stimulate thinking. This analysis is not a recommendation to buy, sell, hold or sell short any security (stock ETF or otherwise). We all need to think for ourselves when it comes to trading our own accounts. First, it is the only way to really learn. Second, we are the only ones responsible for our decisions. Think of these charts as food for further analysis. Before making a trade, it is important to have a plan. Plan the trade and trade the plan. Among other things, this includes setting a trigger level, a target area and a stop-loss level. It is also important to plan for three possible price movements: advance, decline or sideways. Have a plan for all three scenarios BEFORE making the trade. Consider possible holding times. And finally, look at overall market conditions and sector/industry performance.

