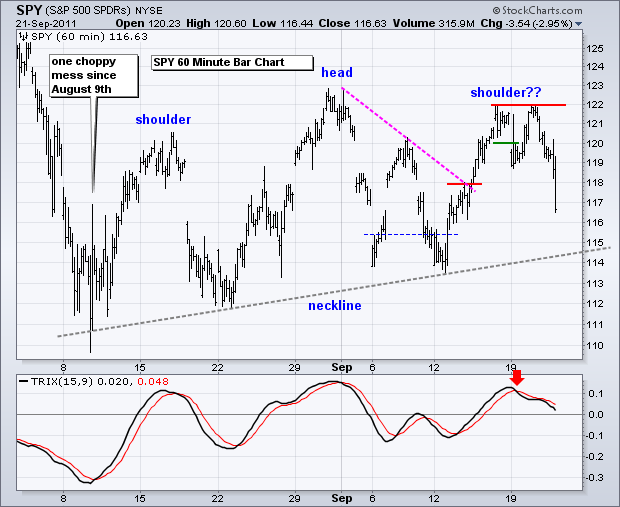
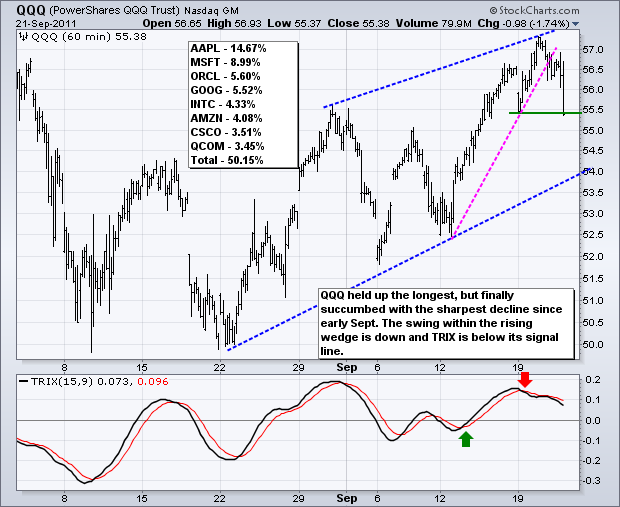
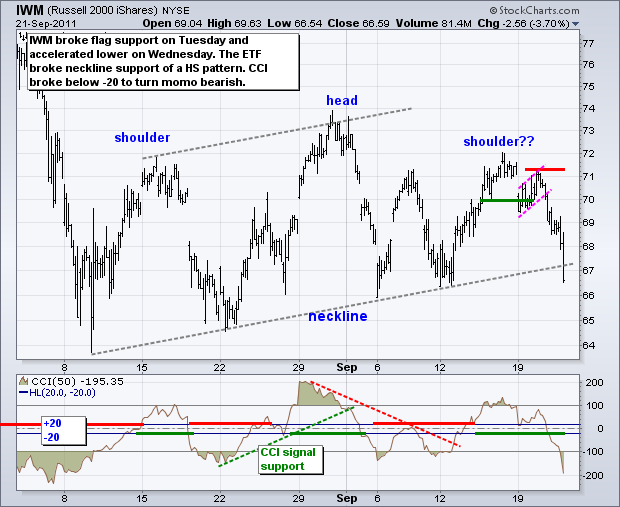
It is getting ugly. Asian and European stocks are down sharply. Gold, the Euro and oil are also down. The Dollar and US Treasuries are the only positive spots. It is a classic flight to safety or move to the risk-off trade. The Fed pretty much echoed the sentiments of the market with its policy statement. In particular, the Fed noted that there are significant downside risks to the economy and instability in the financial system. This is not what the market wanted to hear. The S&P 500 ETF (SPY) started its breakdown on Monday with a decline below 120 and the TRIX moving below its signal line. Even though the ETF bounced on Tuesday, this bounce was short-lived as SPY met resistance at 122 and declined in the final hour. The decline extended on Wednesday with a serious acceleration after the FOMC policy statement. Keep in mind that the major index ETFs fell off cliffs in late July and early August. These big declines reversed the bigger uptrends. A long consolidation period followed these trend-reversing declines. It now looks like the bigger downtrend is reasserting itself. The September lows mark the next possible support for SPY. Based on the weekly chart, I expect a downside continuation to extend to the low 100s.
**************************************************************************
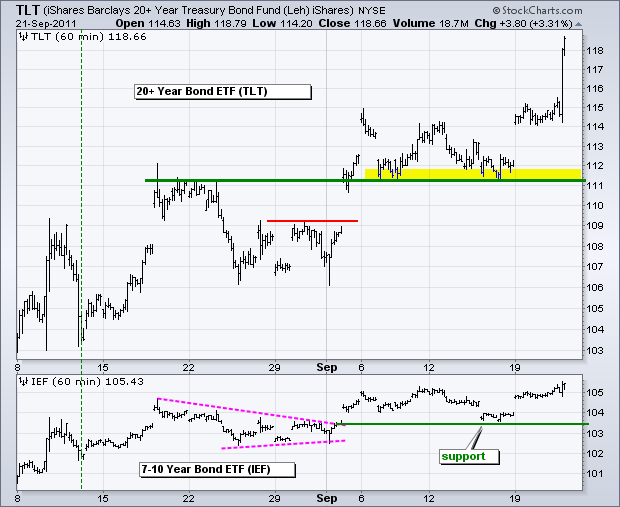
The 20+ year Bond ETF (TLT) surged as the FOMC announced operation twist. This program will purchase longer dated Treasuries (>6 years) and sell an equal amount of shorter term Treasuries (<3 years). The 30-year Bond was the big beneficiary yesterday with a massive 3+ percent pop. TLT is up some 10% from its September low and going parabolic. Key support remains at 111.
**************************************************************************
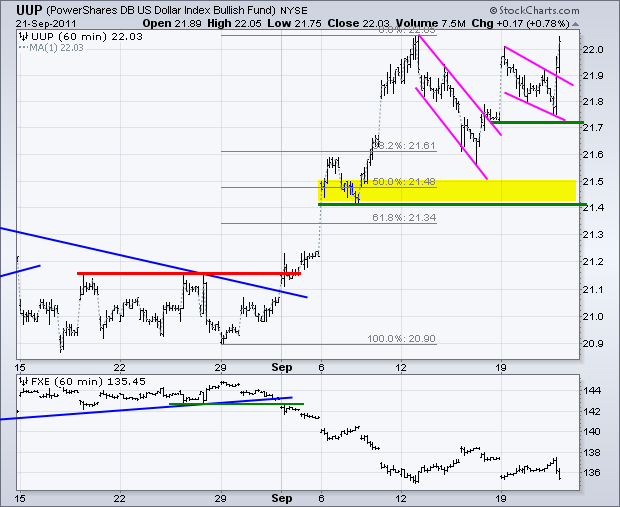
The US Dollar Fund (UUP) surged with a flag breakout on Friday-Monday, pulled back Tuesday-Wednesday and broke flag resistance late Wednesday. The second flag breakout signals yet another continuation higher and reinforces support at 21.70. I will leave key support at 21.40 for now.
**************************************************************************
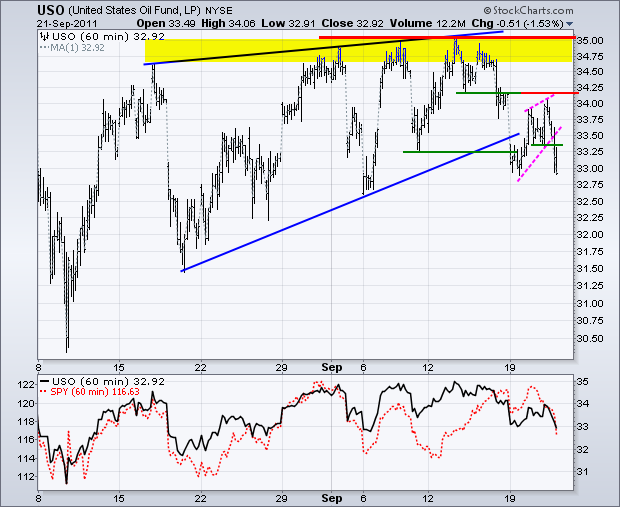
I am going to move to the US Oil Fund (USO) for short-term analysis of oil. I still like the 12-Month US Oil Fund (USL) and Spot Light Crude ($WTIC) better for long-term analysis. USL is based on 12-months of futures contracts, whereas USO is based on 3-months. USO does not track as well over the long term, but is more liquid and tracks well for the short-term. The US Oil Fund (USO) broke down with a sharp decline on Friday-Monday. After a rising wedge bounce early this week, the ETF continued lower with a sharp decline below 33 on Wednesday. I expect oil to follow the stock market.
**************************************************************************
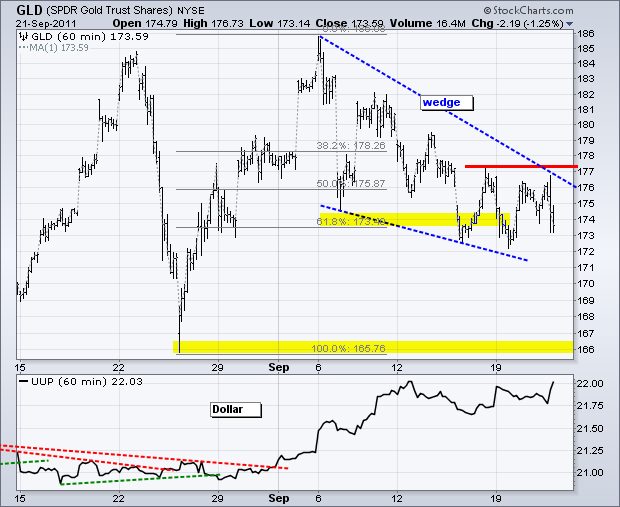
Gold moved higher from late morning to early afternoon, but did not break resistance and declined sharply after the Fed policy statement. This is not a good sign at all. Stocks, oil and the Euro were falling apart, but gold did not attract money as a safe-haven. The pattern still looks interesting, but the trend is clearly down as long as the wedge falls. A break above 177.50 is needed to reverse this downtrend. Otherwise, a move to next support around 166 is expected.
Key Economic Reports:
Thu - Sep 22 - 08:30 - Initial Claims
Thu - Sep 22 - 10:00 - Leading Indicators
Fri - Sep 23 - 07:00 - TGIF
Charts of Interest: On Hiatus.....
This commentary and charts-of-interest are designed to stimulate thinking. This analysis is not a recommendation to buy, sell, hold or sell short any security (stock ETF or otherwise). We all need to think for ourselves when it comes to trading our own accounts. First, it is the only way to really learn. Second, we are the only ones responsible for our decisions. Think of these charts as food for further analysis. Before making a trade, it is important to have a plan. Plan the trade and trade the plan. Among other things, this includes setting a trigger level, a target area and a stop-loss level. It is also important to plan for three possible price movements: advance, decline or sideways. Have a plan for all three scenarios BEFORE making the trade. Consider possible holding times. And finally, look at overall market conditions and sector/industry performance.

