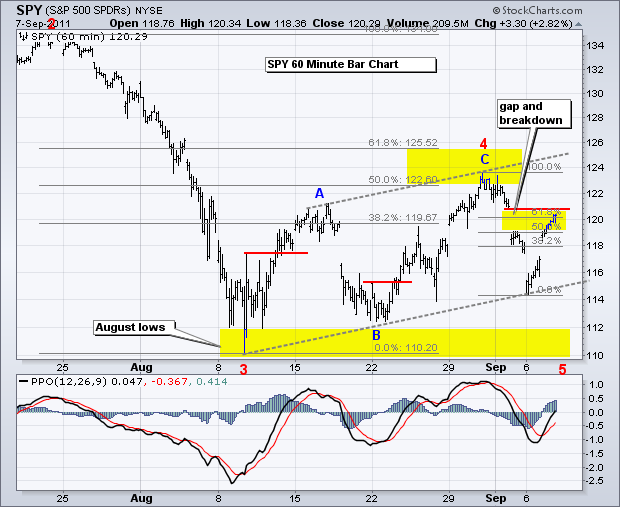
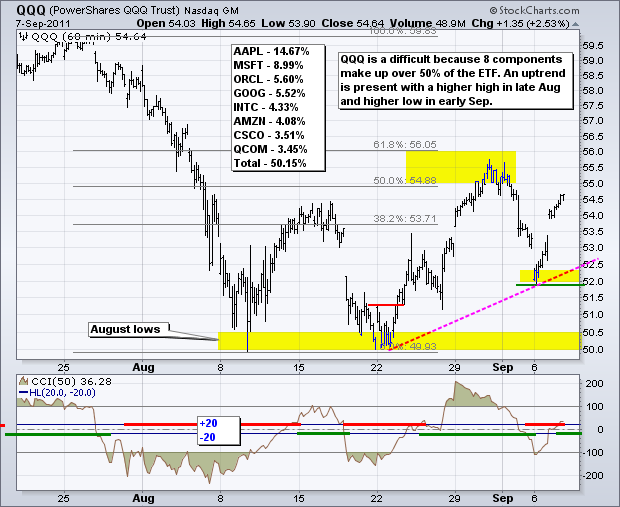
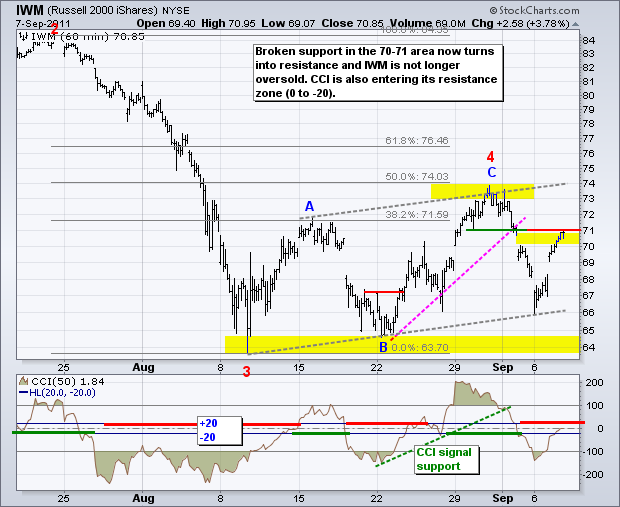
All this stimulus talk has stimulated the bulls. Charles Evens, head of the Chicago Fed, called on stimulus to cut the unemployment rates. Obama will no doubt offer some sort of stimulus plan to create more jobs. The FOMC is also likely to join the party with some sort of QE3, be it disguised or not. Economic stimulus is giving the bulls an adrenalin shot and making the bears nervous. Even though the bigger trend is down, this stimulus chatter could prop us the bull or make for continued choppy trading. Traders should try to keep this fundamental news on the back burner and the technical analysis on the front burner. After a weak open on Tuesday, stocks immediately firmed and surged into Wednesday's close. Stocks have been moving higher since around 10AM on Tuesday morning. Overall, stocks have been moving higher since the early August low with rising flags or channels in SPY and IWM. Higher peaks formed from mid August to late August and higher troughs formed from mid August to early September. Technically, the short-term trend is up with these higher peaks and troughs. With the most recent bounce, SPY and IWM have now retraced around 61.80% of the prior decline and both remain well below the late August peak. This is an area to expect resistance, provided the bulls don't get another stimulus shot. Bernanke speaks this afternoon and Obama speaks tonight.
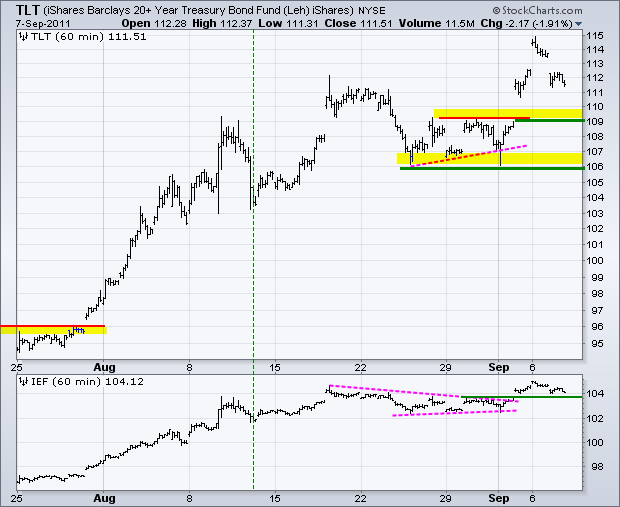
The 20+ year Bond ETF (TLT) pulled back as the stock market bounced on Tuesday-Wednesday. This makes sense because bonds surged as stocks plunged last week. The triangle breakout in TLT is holding and broken resistance turns into the first support zone around 109-110. There is no chance of a trend reversal as long as this breakout holds.
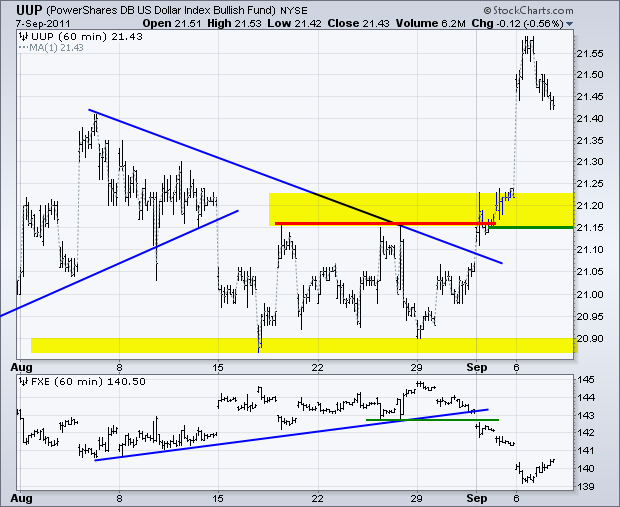
The Euro and the Dollar will be in play today as the European Central Bank (ECB) puts out a policy statement and press conference around 7:45 AM ET. The ECB is expected to keep rates unchanged and traders will be hanging on every word during the press conference for signs of a more dovish policy stance. Lower rates would put downward pressure on the Euro and upward pressure on the greenback. The US Dollar Fund (UUP) broke resistance with a big surge and this breakout is holding. Broken resistance in the 21.15 area becomes the first significant support zone to watch.
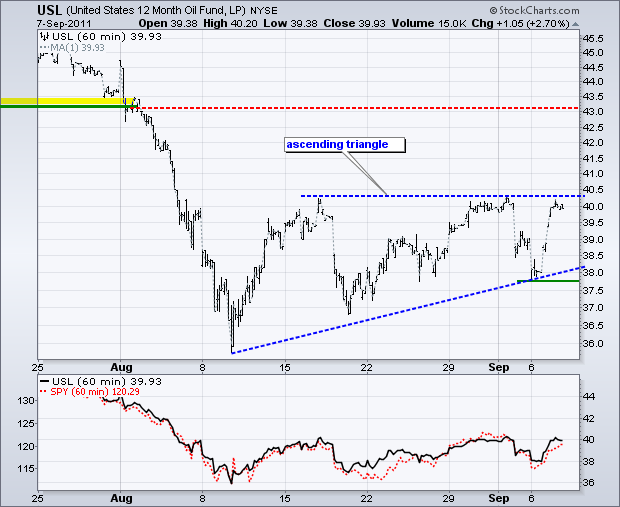
The 12-Month US Oil Fund (USL) continued its bounced along with the stock market and is now challenging the August-September highs. Overall, an Ascending Triangle is taking shape and a break above these highs would argue for a move to next resistance in the 43-43.50 area. Tuesday's opening low marks triangle support. A move below this level would negate the pattern and argue for a test of the August lows. Oil will likely take its cue from the stock market.
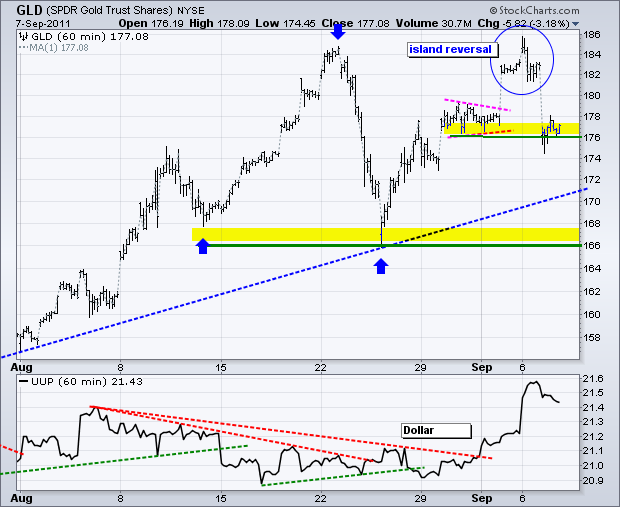
Trading in gold has turned rather violent the last 3-4 weeks. The Gold SPDR (GLD) has three 10+ percent swings since the August 12th low (blue arrows). With a gap up, stall around 185 and gap down, the ETF forged an island reversal at resistance. This reinforces resistance and reverses the short-term uptrend. However, I am not ready to call for a long-term downtrend. Major support remains at 166-168.
Key Economic Reports:
Thu - Sep 08 – 07:45 – European Central Bank Policy Statement
Thu - Sep 08 - 08:30 - Initial Claims
Thu - Sep 08 - 11:00 - Crude Inventories
Thu - Sep 08 - 13:30 – Bernanke Speech on Economy
Thu - Sep 08 - 15:00 - Consumer Credit
Thu - Sep 08 - 19:00 – Obama Jobs Speech
Fri - Sep 09 - 10:00 - Wholesale Inventories
Charts of Interest: Tuesday and Thursday in separate post.
This commentary and charts-of-interest are designed to stimulate thinking. This analysis is not a recommendation to buy, sell, hold or sell short any security (stock ETF or otherwise). We all need to think for ourselves when it comes to trading our own accounts. First, it is the only way to really learn. Second, we are the only ones responsible for our decisions. Think of these charts as food for further analysis. Before making a trade, it is important to have a plan. Plan the trade and trade the plan. Among other things, this includes setting a trigger level, a target area and a stop-loss level. It is also important to plan for three possible price movements: advance, decline or sideways. Have a plan for all three scenarios BEFORE making the trade. Consider possible holding times. And finally, look at overall market conditions and sector/industry performance.

