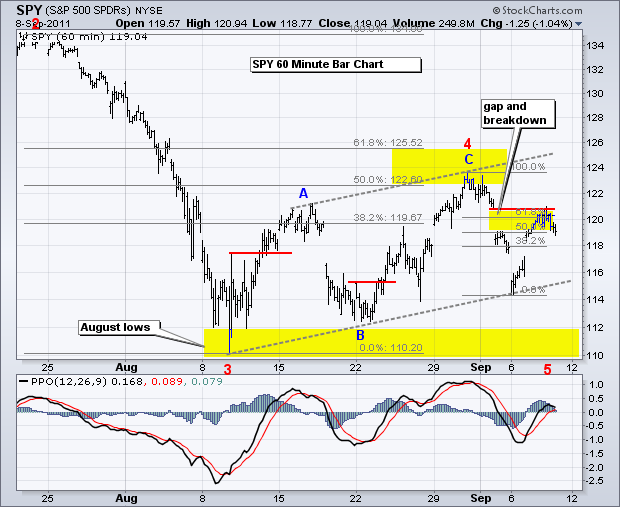
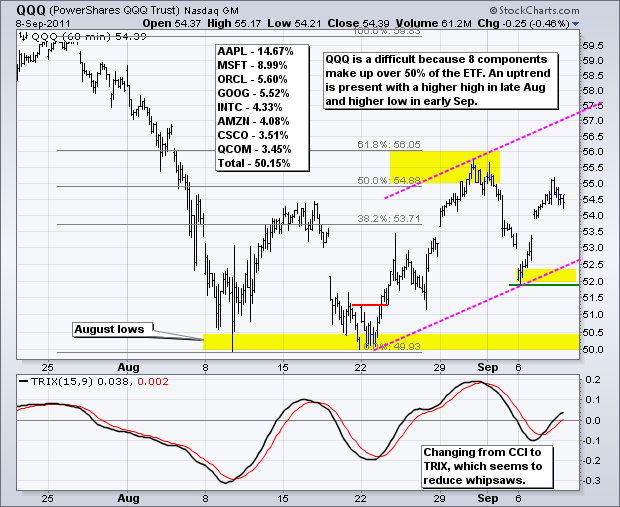
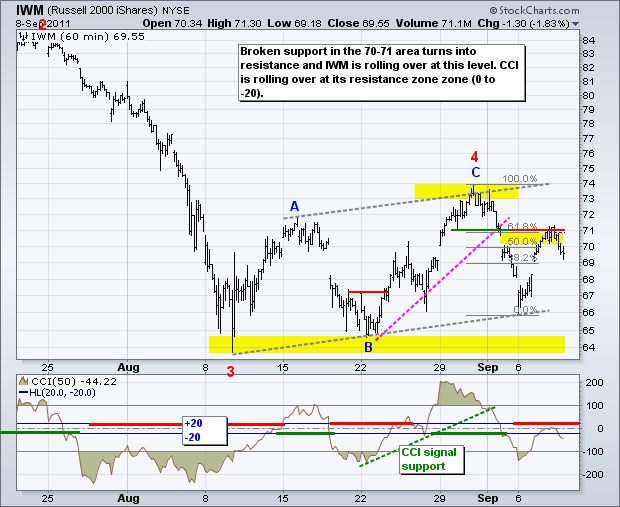
Stimulus-response. The stock market is like an ameba reacting to stimulus pokes from Washington, the Fed and the European Central Bank. Even though nothing is concrete, the market is certainly expecting some stimulus down the road. Sometimes the expectations are better than the real thing. Stocks remain in an uptrend since the second week of August, but SPY and IWM are hitting resistance at key retracement levels. The S&P 500 ETF (SPY) chart sums up the market situation quite well. Frankly, SPY could go either way, or even no way. The trend remains up since the August 9th low. SPY formed higher highs in mid and late August as well as higher lows on August 22nd and September 6th. After opening sharply lower on September 6th, SPY rebounded and followed through with a gap-gain on Wednesday. This oversold bounce carried the ETF to the 61.80% retracement and top of the gap zone (Sept 2nd gap). This is a logical spot for resistance and a reversal. The Percent Price Oscillator (PPO) edged into positive territory and started rolling over. A move below the signal line and into negative territory would turn this momentum oscillator short-term bearish.
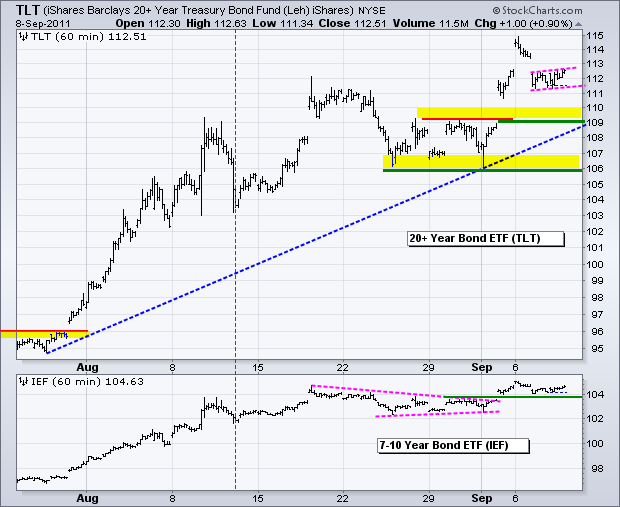
Just like the Gold SPDR (GLD), the 20+ year Bond ETF (TLT) has an island reversal working this week. The ETF gapped above 113, stalled and then gapped below 113. A rising flag formed after the gap down. A move below 111 would signal a continuation lower and target a decline to the next support zone around 109. The bigger trend remains up with major support in the 106-107 area.
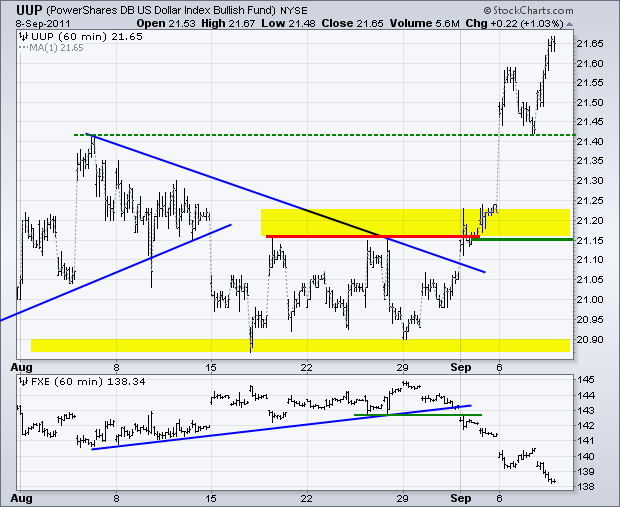
The US Dollar Fund (UUP) opened strong and continued strong throughout the day. There is no change on this chart. The only negative is the short-term overbought situation after the biggest seven day advance since mid May. In fact, the May-June-July highs mark long-term resistance in the 21.75-21.85 area. Short-term, the trend is clearly up here with broken resistance marking the first support in the 21.40 area. Key support is at 21.15 and this level will likely be raised in the coming days and weeks.
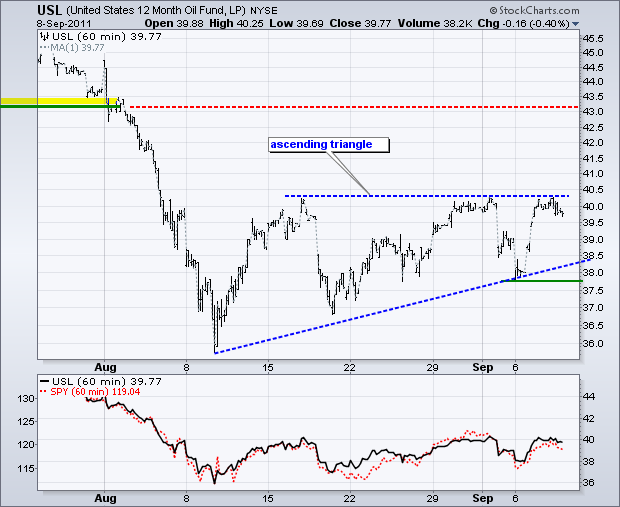
The 12-Month US Oil Fund (USL) stalled and pulled back along with the stock market. Overall, the Ascending Triangle remains and a break above the August high would be bullish. This would target a move towards the next resistance around 43.
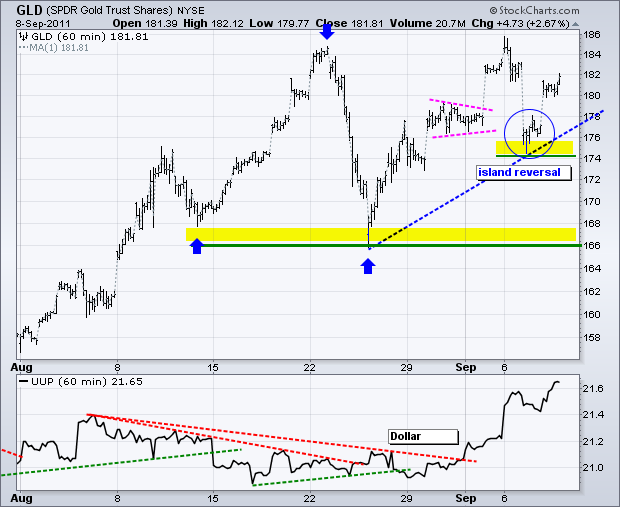
Day-to-day trading in gold remains quite volatile, but the week-to-week trading shows a clear uptrend. This has never been in question. Gaps in the Gold SPDR (GLD) need to be taken with a grain of salt because GLD is reacting to the futures, which have been trading in Japan, Europe and the US ahead of the GLD open. Big gaps are, however, noteworthy. GLD now has three big gaps this week. With a gap above 180 on Thursday, another island reversal formed. This reinforces support in the 174-176 area.
Key Economic Reports:
Fri - Sep 09 - 10:00 - Wholesale Inventories
Charts of Interest: Tuesday and Thursday in separate post.
This commentary and charts-of-interest are designed to stimulate thinking. This analysis is not a recommendation to buy, sell, hold or sell short any security (stock ETF or otherwise). We all need to think for ourselves when it comes to trading our own accounts. First, it is the only way to really learn. Second, we are the only ones responsible for our decisions. Think of these charts as food for further analysis. Before making a trade, it is important to have a plan. Plan the trade and trade the plan. Among other things, this includes setting a trigger level, a target area and a stop-loss level. It is also important to plan for three possible price movements: advance, decline or sideways. Have a plan for all three scenarios BEFORE making the trade. Consider possible holding times. And finally, look at overall market conditions and sector/industry performance.

