It is another week and we have yet another promise from EU leaders. Dexia Bank passed the European stress test a few months ago and went belly up last week. This weekend we saw another flurry of pledges and deadlines to fixed the European debt situation. According to Sarkozy and Merkel, the new deadline is the end of October. Yes, we have another pledge to fix the problem once and for all, but NO details and NO definitive agreement. The markets are reacting bullishly to the news this morning. European stocks poised to start higher, the Euro is sharply higher and oil is up modestly. Gold is also up and the Dollar is down. These moves will continue the short-term trends that have been in place for about a week.
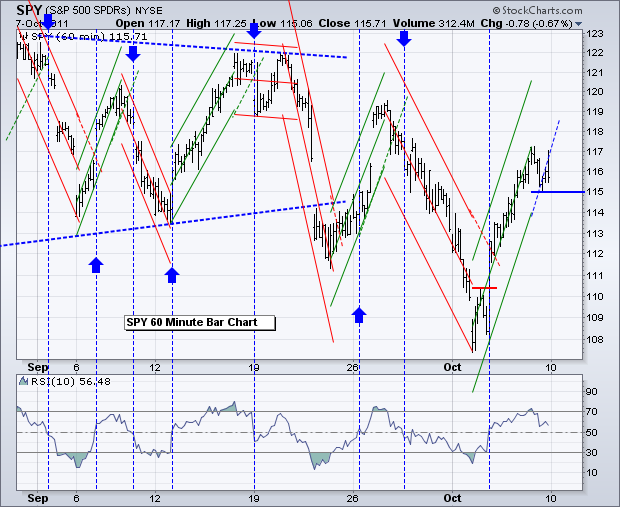
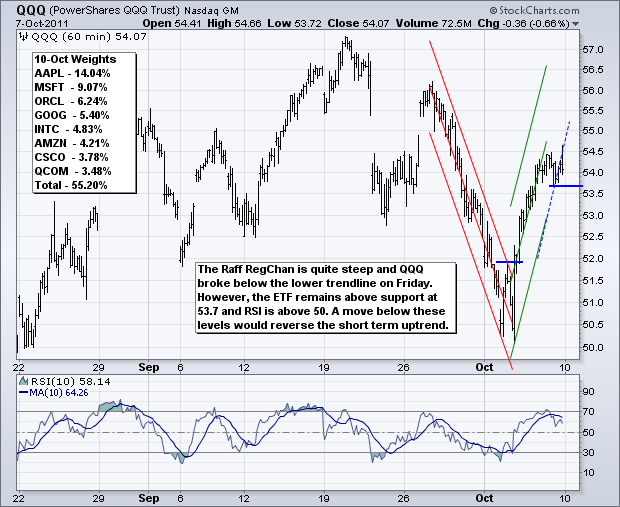
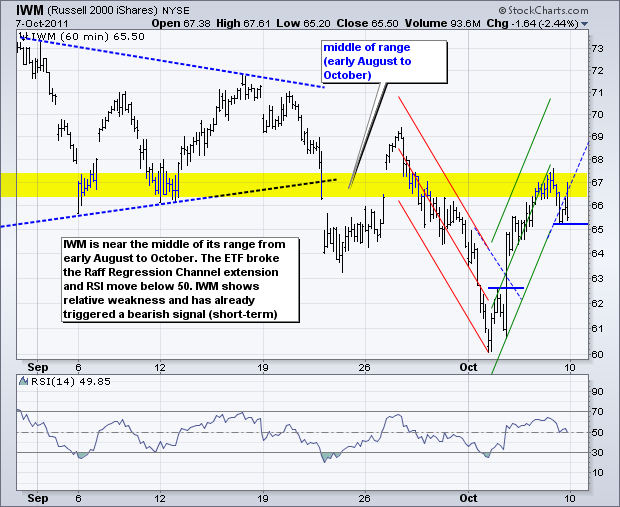
There are still three trends at work in the stock market. The long-term trend (a few months) is down after the August breakdowns. The medium-term trend (several weeks) is flat because stocks have traded sideways since early August. The short-term trend (1-2 weeks) is up as stocks bottomed with last Tuesday's reversal. Perhaps this short-term trend will continue Monday so we can see another turnaround Tuesday. The chart below shows SPY with the Raff Regression Channel and RSI(10). The channel extends from the closing low (4-Oct 9:30-10AM) to the closing high (7-Oct 9:30-10AM) of the current move. This makes for a very steep channel that is unlikely to hold, even if the uptrend just slows and does not actually reverse. Therefore, I would add a qualifying indicator to confirm a trend reversal. This can be either a support break or an RSI break below 50, or both. Support is set at 115 for SPY. A break below this level and an RSI break below 50 would reverse the short-term uptrend. The dotted blue line shows the Raff Regression Channel signals that were confirmed by RSI. Some are a few bars later, but confirmation can help reduce whipsaws and losses.
**************************************************************************
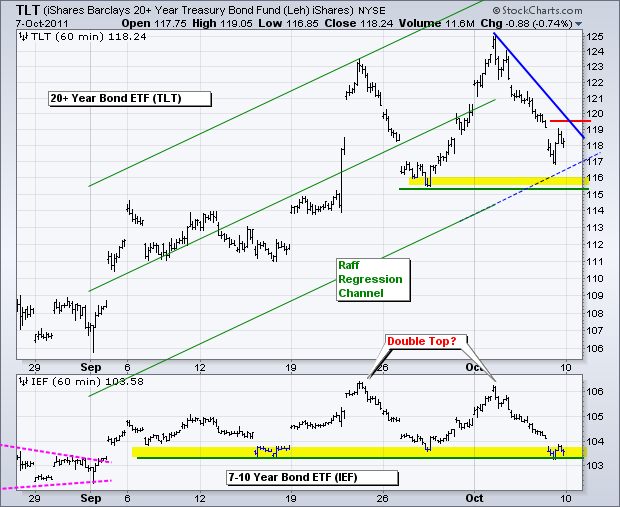
In sticking with uses for the Raff Regression Channel, I am showing the 20+ year Bond ETF (TLT) with a channel extending up from the late August closing low. This channel extends to the early October closing high. The lower trendline extension (blue dotted line) marks first support around 116.5, while the late September low marks support in the 115-116 area. There is clearly a support zone just under last week's lows. The swing within the six week uptrend is down with resistance marked at 119.50.
**************************************************************************
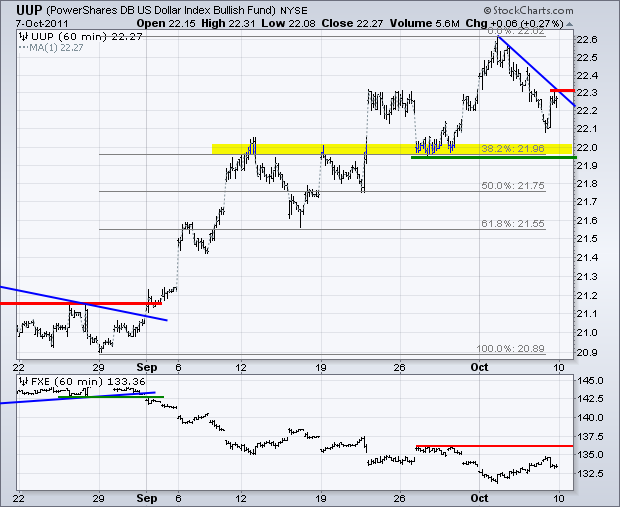
The US Dollar Fund (UUP) corrected as stocks moved higher and treasuries moved lower. Risk-on dominated the trading environment from Tuesday to Friday. UUP remains in a bigger uptrend and a short-term downtrend (correction). There is support in the 22 area from the late September low and 38.2% retracement. Downswing resistance is set at 22.30 and a break above this level would signal a resumption of the bigger uptrend.
**************************************************************************
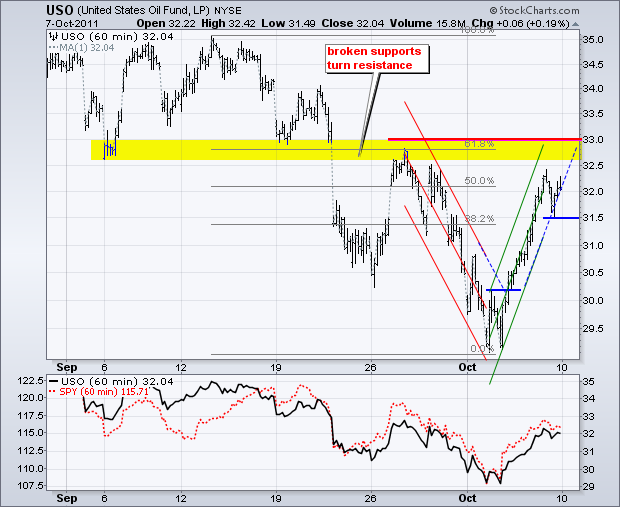
The US Oil Fund (USO) continues to follow the stock market higher. USO is nearing resistance from broken support and the 61.80% retracement. The current swing is up, but within a bigger downtrend. USO tested the lower extension of the Raff Regression Channel. This extension is quite steep so I would watch support from Friday's reaction low at 31.50 for a trend reversal.
**************************************************************************
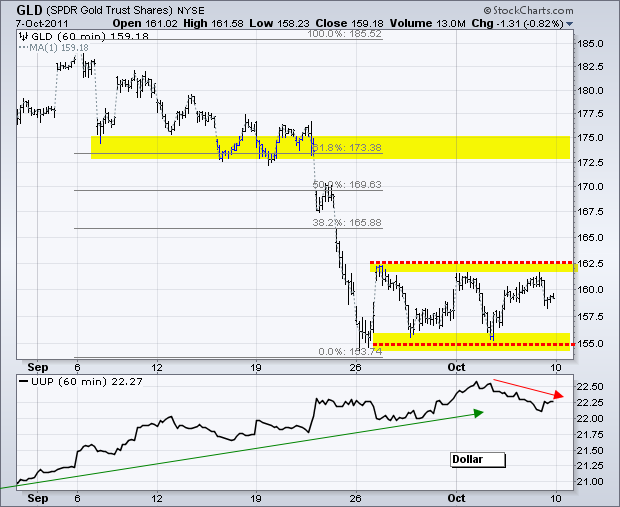
The Gold SPDR (GLD) got a bounce last week as the Dollar corrected. Overall, GLD remains within a consolidation with clear support and resistance levels. A breakout at 162.5 would be bullish for gold and argue for a move to the next resistance zone. Support is set at 155. A break here would signal a continuation lower. Gold remains tied to the Dollar and traders need to watch this chart as well.
**************************************************************************
Key Economic Reports:
Tue - Oct 11 14:00 FOMC Minutes
Wed - Oct 12 07:00 MBA Mortgage Index
Thu - Oct 13 08:30 Jobless Claims
Thu - Oct 13 11:00 Oil Inventories
Fri - Oct 14 08:30 Retail Sales
Fri - Oct 14 09:55 Michigan Sentiment
Fri - Oct 14 10:00 Business Inventories
Charts of Interest: Tuesday and Thursday in separate post.
This commentary and charts-of-interest are designed to stimulate thinking. This analysis is not a recommendation to buy, sell, hold or sell short any security (stock ETF or otherwise). We all need to think for ourselves when it comes to trading our own accounts. First, it is the only way to really learn. Second, we are the only ones responsible for our decisions. Think of these charts as food for further analysis. Before making a trade, it is important to have a plan. Plan the trade and trade the plan. Among other things, this includes setting a trigger level, a target area and a stop-loss level. It is also important to plan for three possible price movements: advance, decline or sideways. Have a plan for all three scenarios BEFORE making the trade. Consider possible holding times. And finally, look at overall market conditions and sector/industry performance.

