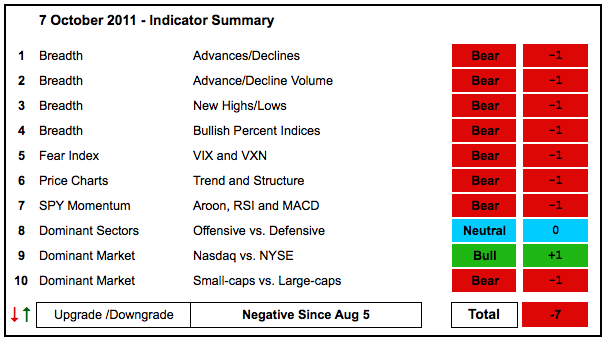
Despite a big reversal on Tuesday and good gains Wednesday-Thursday, the Indicator Summary remains decidedly negative. These gains simply erased the losses from Monday and the gain for the week is still modest compared to recent volatility. More importantly, lower lows formed with the plunge on October 3rd (Monday) and we have yet to see resistance breaks for the major index ETFs, SPDRs or key breadth indicators. The bulk of the evidence remains bearish. Keep in mind that this is a trend following approach that will never catch an exact bottom. It is simply a method to measure current conditions in the stock market.
- AD Lines: Bearish. The Nasdaq AD Line hit a 52-week low on Monday and remains in a clear downtrend. The NYSE AD Line actually formed a small bullish divergence from early August to early October. However, the trend remains down and a break above the late September high is needed to suggest otherwise.
- AD Volume Lines: Bearish. The Nasdaq and NYSE AD Volume Lines hit new 52-week lows to begin October and then rebounded sharply. Even so, we have yet to see a breakout above key resistance from the late August and September highs.
- Net New Highs: Bearish. New lows continue to outpace new highs on both the NYSE and the Nasdaq. The Cumulative Net New Highs Lines are falling and below their 10-day EMAs.
- Bullish Percent Indices: Bearish. Eight of the nine BPIs are below 50%. Only utilities BPI (69.70%) remains above 50%.
- VIX/VXN: Bearish. The CBOE Volatility Index ($VIX) and the Nasdaq 100 Volatility Index ($VXN) moved sharply lower the last three days, but remain well above 30 and show more fear than confidence.
- Trend Structure: Bearish. QQQ held its August low, but the other major index ETFs broke below their August lows (DIA, IWM, MDY and SPY). Despite this week's massive recovery, the major index ETFs remain below resistance from the late August and September highs.
- SPY Momentum: Bearish. RSI edged above 50, but needs to break the 50-60 zone to show real strength. MACD(5,35,5) remains in negative territory and Aroon (20) is at -50.
- Offensive Sector Performance: Neutral. The Technology ETF (XLK) and the Consumer Discretionary SPDR (XLY) held their August lows to show some relative strength, but the Finance SPDR (XLF) and the Industrials SPDR (XLI) broke these lows to show weakness.
- Nasdaq Performance: Bullish. The $COMPQ:$NYA ratio hit another 52-week high in September and remains in an uptrend overall. The tech-laden Nasdaq shows relative strength.
- Small-cap Performance: Bearish. The $RUT:$OEX ratio hit a new 52-week low in early October and then rebounded sharply. Nevertheless, the overall trend remains down and small-caps have shown relative weakness since mid July.
- Breadth Charts (here) and Inter-market charts (here) have been updated.
This table is designed to offer an objective look at current market conditions. It does not aim to pick tops or bottoms. Instead, it seeks to identify noticeable shifts in buying and selling pressure. With 10 indicator groups, the medium-term evidence is unlikely to change drastically overnight.

Previous turns include:
Positive on 11-Sept-09
Negative on 5-Feb-10
Positive on 5-March-10
Negative on 11-Jun-10
Positive on 18-Jun-10
Negative on 24-Jun-10
Positive on 6-Aug-10
Negative on 13-Aug-10
Positive on 3-Sep-10
Negative on 18-Mar-11
Positive on 25-Mar-11
Negative on 17-Jun-11
Positive on 30-Jun-11
Neutral on 29-Jul-11
Negative on 5-August-11


