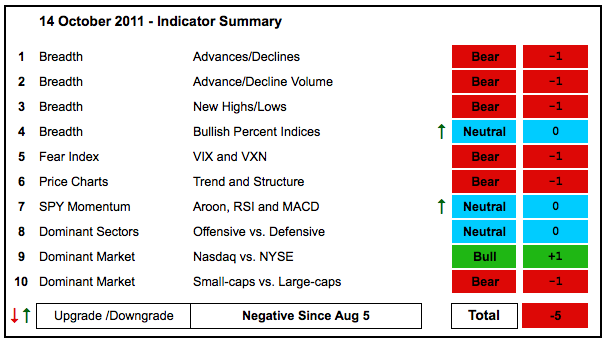
Stocks reversed last Tuesday and surged the last nine days, but this has not been enough to push the indicator summary into positive territory. Another week or two of strength would likely lead to resistance breakouts in the major index ETFs and some key breadth statistics. For now though, the major index ETFs have yet to break their September highs. The AD Volume Lines also remain below key resistance and we have yet to see an expansion of new highs, even though new lows dried up.
- AD Lines: Bearish. The Nasdaq AD Line surged after hitting a 52-week low on 3-Oct, but remains in a downtrend overall. The NYSE AD Line formed a bullish divergence from August to October and surged higher. Key resistance from the August-September highs is just ahead – an unbroken.
- AD Volume Lines: Bearish. The Nasdaq and NYSE AD Volume Lines hit new 52-week lows to begin October and then rebounded sharply. Even so, we have yet to see a breakout above key resistance, which is marked by the highs extending from mid August to September.
- Net New Highs: Bearish. New lows dried up over the last week, but we have yet to see any new highs. The Cumulative Net New Highs Lines remain in downtrends and below their 10-day EMAs.
- Bullish Percent Indices: Neutral. With the sharp rally, four of the nine sector Bullish Percent Indices are above 50%. One is at 50% and the remaining four are below 50%. The S&P 500 Bullish Percent Index ($BPSPX) reflects this standoff as it sits at 50.60%.
- VIX/VXN: Bearish. The CBOE Volatility Index ($VIX) and the Nasdaq 100 Volatility Index ($VXN) moved sharply lower as stocks moved sharply higher. This indicator is now testing support as the major index ETFs challenge resistance. A break below the September lows would be positive.
- Trend Structure: Bearish. Despite a sharp rally the last nine days, none of the major index ETFs have broken above their mid September highs. At best, a large trading range is in place since early August. At worst, the breakdown in early August remains the dominant chart feature.
- SPY Momentum: Neutral. RSI is above 50, but has yet to break the 50-60 resistance zone. MACD(5,35,5) moved into positive territory for the first time since late July. Aroon (20) also turned positive, but has yet to exceed +50, which is needed to show a strong up thrust.
- Offensive Sector Performance: Neutral. The Technology ETF (XLK) broke its September highs and shows relative strength. The Consumer Discretionary SPDR (XLY) is challenging resistance and also leading. The Finance SPDR (XLF) and the Industrials SPDR (XLI) remain the laggards to keep this indicator group bearish.
- Nasdaq Performance: Bullish. The $COMPQ:$NYA ratio hit another 52-week high in September and remains in an uptrend overall. The tech-laden Nasdaq shows relative strength.
- Small-cap Performance: Bearish. The $RUT:$OEX ratio hit a new 52-week low in early October and surged the last nine days. Even so, it remains in a downtrend overall. Small-caps may show relative strength for nine days, but they show relative weakness for almost three months now.
- Breadth Charts (here) and Inter-market charts (here) have been updated.
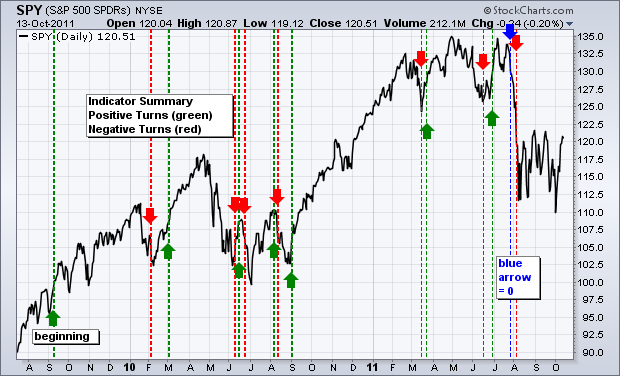
This table is designed to offer an objective look at current market conditions. It does not aim to pick tops or bottoms. Instead, it seeks to identify noticeable shifts in buying and selling pressure. With 10 indicator groups, the medium-term evidence is unlikely to change drastically overnight.
Previous turns include:
Positive on 11-Sept-09
Negative on 5-Feb-10
Positive on 5-March-10
Negative on 11-Jun-10
Positive on 18-Jun-10
Negative on 24-Jun-10
Positive on 6-Aug-10
Negative on 13-Aug-10
Positive on 3-Sep-10
Negative on 18-Mar-11
Positive on 25-Mar-11
Negative on 17-Jun-11
Positive on 30-Jun-11
Neutral on 29-Jul-11
Negative on 5-August-11


