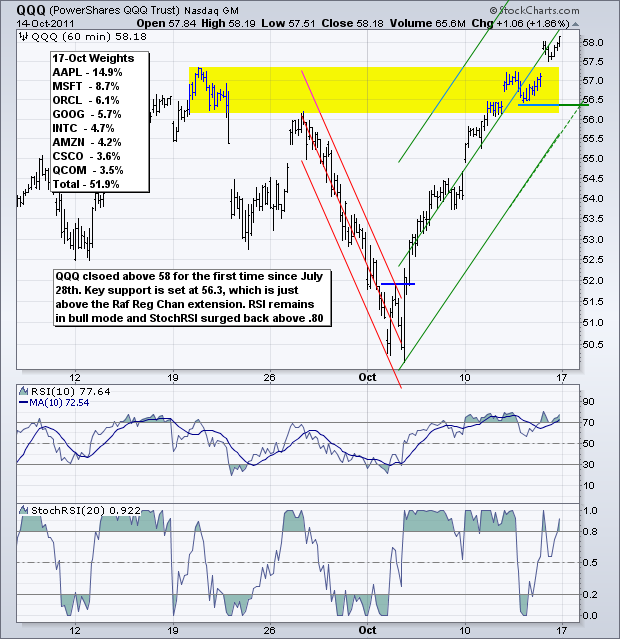
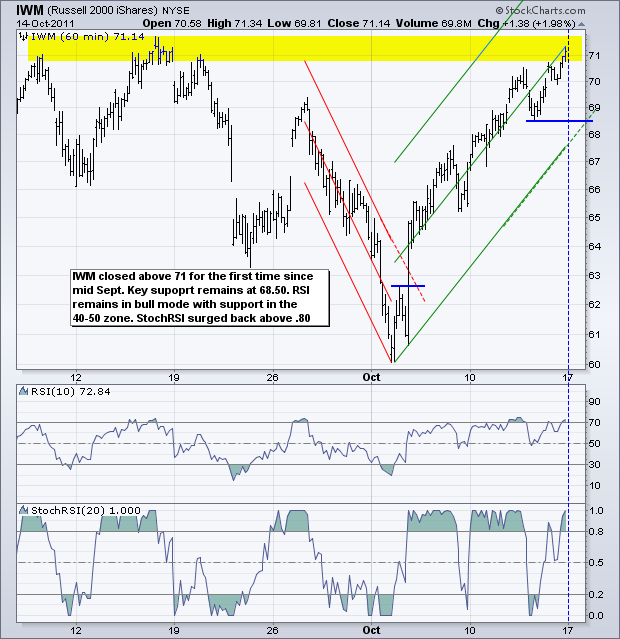
The markets remain in RISK-ON mode. This is bullish for the Euro, stocks, commodities and, perhaps, gold. This is bearish for the Dollar and Treasuries. Even though the short-term trends are getting extended, we have yet to see reversals that would suggest an end to this risk-on environment. Earnings season is in full bloom this week and EU leaders are frantically working for a comprehensive solution to the debt crisis. We may be in a buy-the-rumor and sell-the-news situation. The rumors are better-than-expected earnings from tech companies and the EU debt solution. These rumors will turn into news by the end of the month, which means this rally may hold up for 1-2 more weeks.
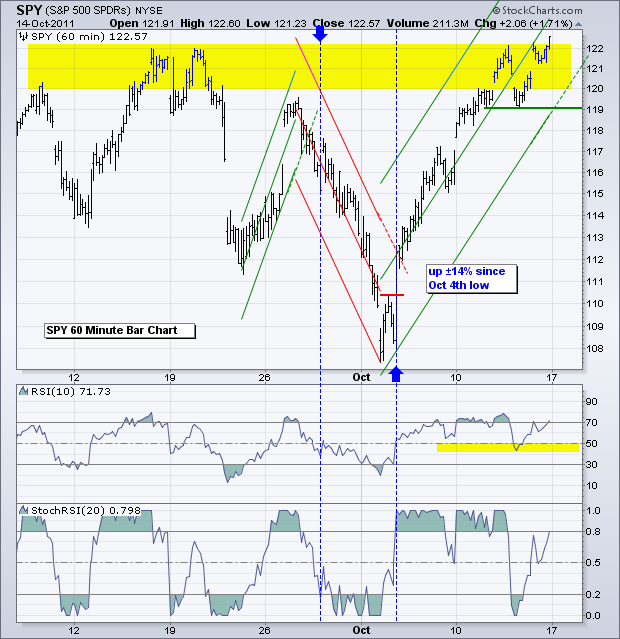
The S&P 500 ETF (SPY) surged above its September highs with a close above 122 on Friday. This means the Raff Regression Channel will be extended yet again. The lower extension and Thursday's low combine to mark support at 119. RSI bounced off the 40-50 zone last week and moved back above 70. This zone now marks momentum support. The volatile StochRSI surged back to .798, just a hair below the .80 bullish threshold. Three of four technical features are bullish: the Raff Regression Channel extended, support held and RSI is above 50. StochRSI moved into bear mode with last week's plunge below .20 and needs to surge back above .80 to reclaim bullish status.
**************************************************************************
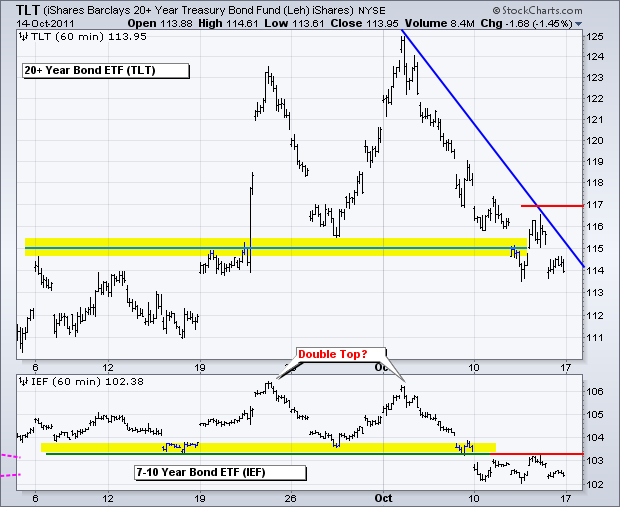
Treasuries remain under pressure as economic reports came up better-than-expected the last two weeks and the stock market rallied. Strength in the Euro is also weighing on Treasuries as a safe-haven. The 20+ year Bond ETF (TLT) extended its downtrend with a move below 114 on Friday. Key resistance remains at 117. The 7-10 year Bond ETF (IEF) broke Double Top support last Monday and broken support turned into resistance.
**************************************************************************
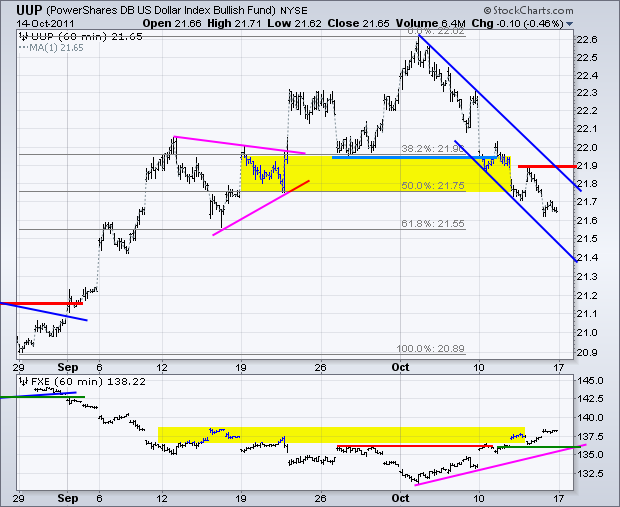
The US Dollar Fund (UUP) remains in a downswing as a falling price channel takes shape. The decline has retraced around 50-62% of the prior advance. With the bigger trend up, I am still expecting support and a reversal in this area. A move above 21.90 would break the upper trendline of this channel. Also watch for the Euro Currency Trust (FXE) to break support at 136.30 to confirm.
**************************************************************************
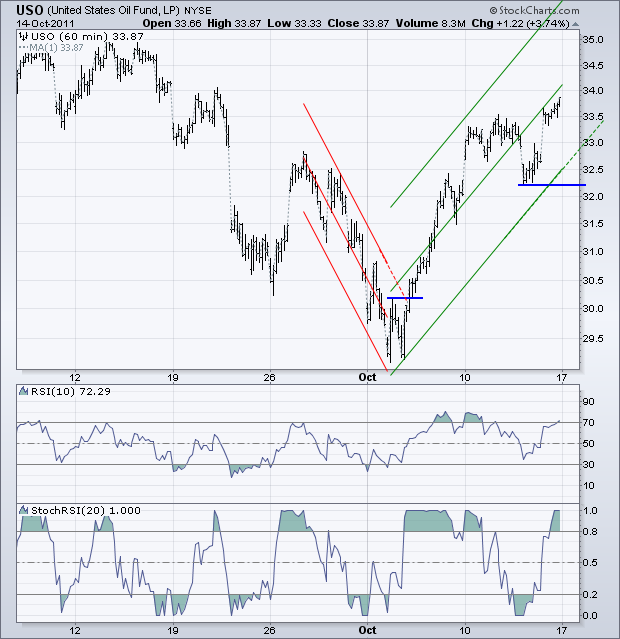
The breakdown in the US Oil Fund (USO) was brief as the ETF surged above 33.50 on Friday. Last week's breakdown was questionable because stocks and the Euro held up. With a new high, I am extending the Raff Regression Channel and marking key support at 32.20.
**************************************************************************
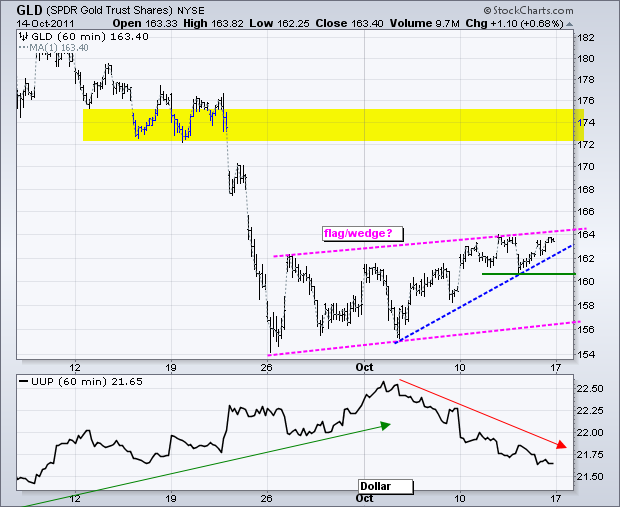
The Gold SPDR (GLD) has been edging higher since late September. The most recent advance started with a peak in the Dollar on October 4th. The Dollar has since moved steadily lower and gold has moved higher. Even though the overall advance looks like a bear flag on the daily chart, there are simply no signs of weakness yet. Last week's lows mark first support at 106.70. Flag support is set at 156.
**************************************************************************
Key Economic Reports:
Mon - Oct 17 - 08:30 - Empire Manufacturing
Mon - Oct 17 - 09:15 - Industrial Production/Capacity Utilization
Tue - Oct 18 - 08:30 - PPI
Tue - Oct 18 - 13:15 - Bernanke Speaks
Wed - Oct 19 - 07:00 - MBA Mortgage Index
Wed - Oct 19 - 08:30 - CPI
Wed - Oct 19 - 08:30 - Housing Starts/Building Permits
Wed - Oct 19 - 10:30 - Crude Inventories
Wed - Oct 19 - 14:00 - Fed's Beige Book
Thu - Oct 20 - 08:30 - Initial Claims
Thu - Oct 20 - 10:00 - Existing Home Sales
Thu - Oct 20 - 10:00 - Philadelphia Fed
Thu - Oct 20 - 10:00 - Leading Indicators
Sun - Oct 23 – 23:59 – G20 Deadline for EU Leaders!
Charts of Interest: Tuesday and Thursday in separate post.
This commentary and charts-of-interest are designed to stimulate thinking. This analysis is not a recommendation to buy, sell, hold or sell short any security (stock ETF or otherwise). We all need to think for ourselves when it comes to trading our own accounts. First, it is the only way to really learn. Second, we are the only ones responsible for our decisions. Think of these charts as food for further analysis. Before making a trade, it is important to have a plan. Plan the trade and trade the plan. Among other things, this includes setting a trigger level, a target area and a stop-loss level. It is also important to plan for three possible price movements: advance, decline or sideways. Have a plan for all three scenarios BEFORE making the trade. Consider possible holding times. And finally, look at overall market conditions and sector/industry performance.

