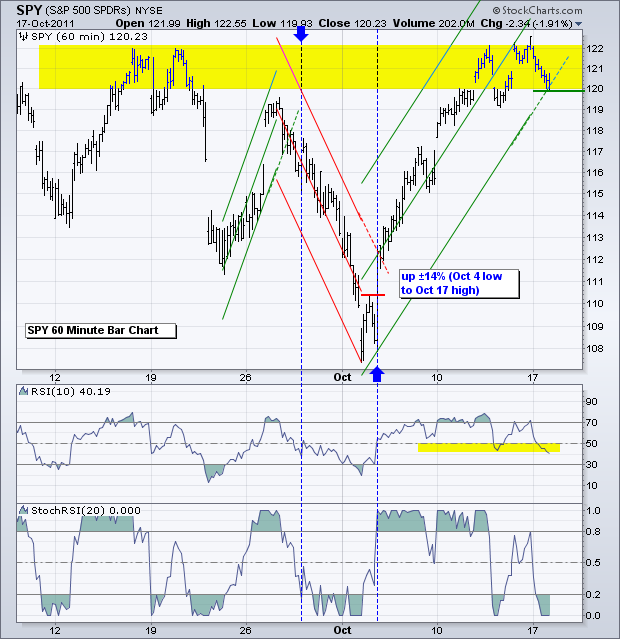
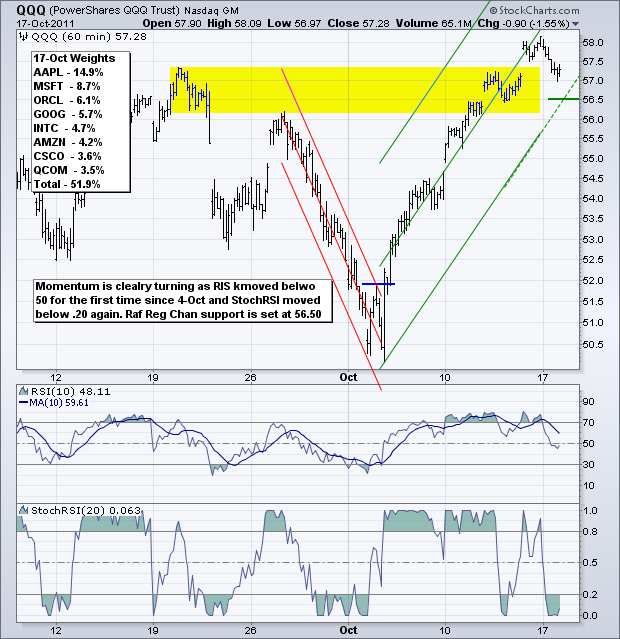
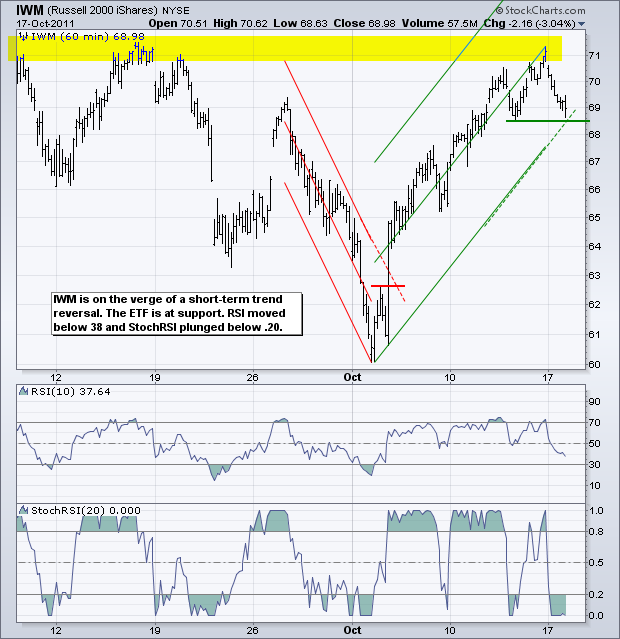
Momentum is changing as RSI and StochRSI moved into bear mode for IWM, QQQ and SPY. As noted last week, StochRSI is one of the most sensitive momentum oscillators, which means it is prone to false signals (whipsaws). StochRSI is the Stochastic Oscillator formula applied to RSI values. This makes it an indicator of an indicator. Plunges below .20 are considered early warnings for a bearish momentum shift. This in turn warns of a bearish trend reversal. I typically use 14-period StochRSI, which is the 14-period Stochastic Oscillator applied to 14-period RSI. Sometimes the timeframe varies depending on the volatility of the underlying security. ETFs with lower volatility may require a shorter timeframe, while ETFs with higher volatility may require a longer timeframe. There is no right or wrong timeframe. It is a judgment call and chartists should experiment with different settings. Turning back to the price charts, the major index ETFs are still above the Raff Regression Channel extensions and these levels mark the next supports to watch. A break below these extensions would turn the bulk of the short-term evidence bearish and argue for at least a correction of the prior surge (Oct 4th to Oct 14th).
**************************************************************************
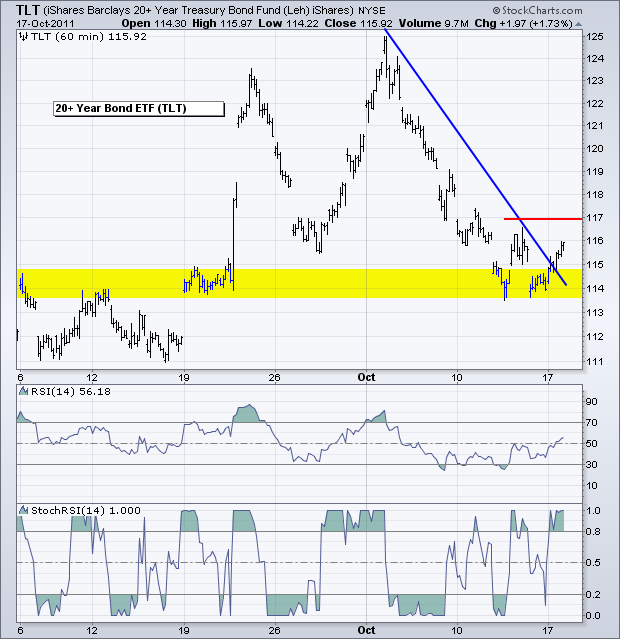
The 20+ year Bond ETF (TLT) plunged as the stock market surged. TLT, however, did establish support last week with two lows in the 113.50 area. In addition, early signs of a trend reversal are taking shape as RSI moved above 50 for the first time since October 5th and StochRSI surged above .80. This is a good example of how hyper StochRSI can be. There were at least three surges above .80 in the last two weeks, but RSI never moved above 50 to confirm. Adding a confirmation factor can reduce false signals in hyper indicators. On the price chart, TLT broke the steep trendline extending down from the early October high and follow through above 117 would completely reverse the downtrend.
**************************************************************************
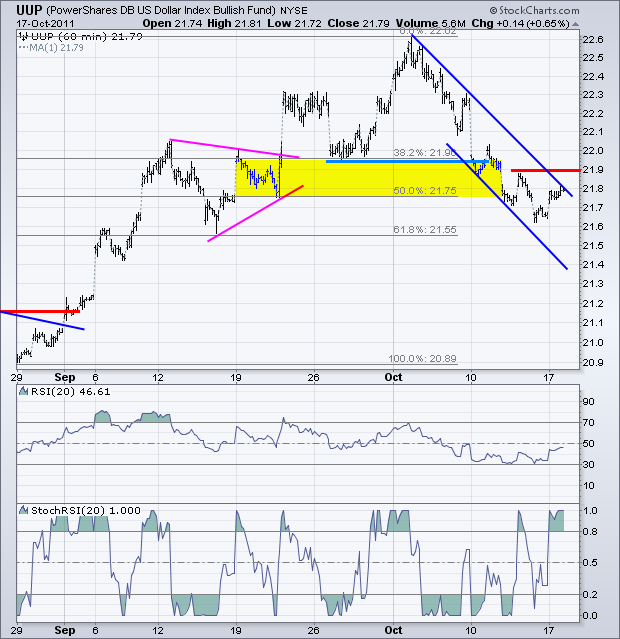
The US Dollar Fund (UUP) chart looks similar to the 20+ year Bond ETF chart above. UUP retraced 50-61.80% of the prior advance with a decline to the 21.60 area. There is support there from the mid September lows as well. Even though the decline extended further than expected, it is still within the realm of a normal correction. A move above the channel trendline and key resistance at 21.90 would reverse the short-term downtrend. RSI and StochRSI are set at 20 because UUP is a little less volatile. RSI has yet to move above 50, but StochRSI surged above .80 for the second time in two weeks.
**************************************************************************
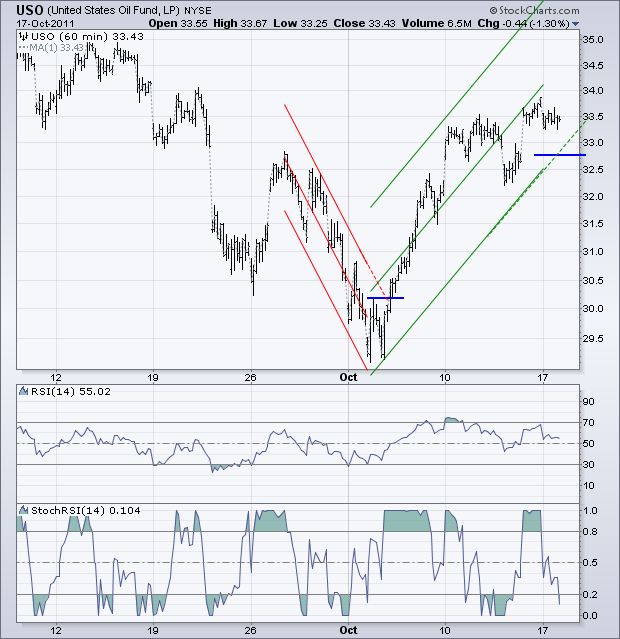
The US Oil Fund (USO) held up quite well considering the depth of the stock market decline. USO remains in an upswing with the Raff Regression Channel extension marking support at 32.75. RSI is holding above 50, but StochRSI moved below .20 by the close. This is just one indicator though. We need to see a break below 32.75 on the price chart and a move below 50 in RSI to confirm.
**************************************************************************
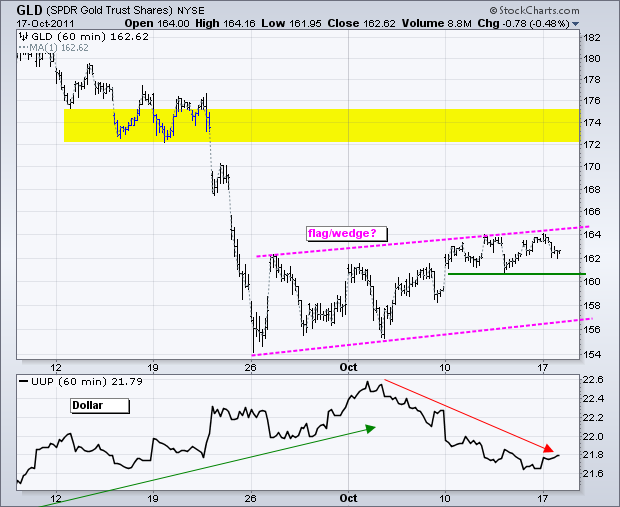
The Gold SPDR (GLD) pulled back as the Dollar bounced on Monday. Overall, the ETF has met resistance in the 160-164 area since late September. Most recently, a consolidation formed in the upper half of the rising flag range. The cup is half full as long as GLD remains above 160. A move below this level would turn the cup half empty and raise the prospects of the bear flag.
**************************************************************************
Key Economic Reports:
Tue - Oct 18 - 08:30 - PPI
Tue - Oct 18 - 13:15 - Bernanke Speaks
Wed - Oct 19 - 07:00 - MBA Mortgage Index
Wed - Oct 19 - 08:30 - CPI
Wed - Oct 19 - 08:30 - Housing Starts/Building Permits
Wed - Oct 19 - 10:30 - Crude Inventories
Wed - Oct 19 - 14:00 - Fed's Beige Book
Thu - Oct 20 - 08:30 - Initial Claims
Thu - Oct 20 - 10:00 - Existing Home Sales
Thu - Oct 20 - 10:00 - Philadelphia Fed
Thu - Oct 20 - 10:00 - Leading Indicators
Sun - Oct 23 – 23:59 – G20 Deadline for EU Leaders!
Charts of Interest: Tuesday and Thursday in separate post.
This commentary and charts-of-interest are designed to stimulate thinking. This analysis is not a recommendation to buy, sell, hold or sell short any security (stock ETF or otherwise). We all need to think for ourselves when it comes to trading our own accounts. First, it is the only way to really learn. Second, we are the only ones responsible for our decisions. Think of these charts as food for further analysis. Before making a trade, it is important to have a plan. Plan the trade and trade the plan. Among other things, this includes setting a trigger level, a target area and a stop-loss level. It is also important to plan for three possible price movements: advance, decline or sideways. Have a plan for all three scenarios BEFORE making the trade. Consider possible holding times. And finally, look at overall market conditions and sector/industry performance.

